

The Kryll team is proud to announce the latest update to our editor, which adds a brand new innovative feature that marks a significant step forward in enriching the experience offered to trading bot creators on the Kryll platform: the heatmap.
The heatmap feature is an advanced functionality that enables editor users to visualize the frequency with which the various blocks of their strategy are activated. In other words, it provides a visual representation of how the trading strategy is being executed in real time. With this feature, trading strategy creators can quickly identify which blocks are most or least used, enabling efficient diagnosis and optimization of their strategies. The potential of the heatmap feature in the Kryll editor can be quite significant for traders:
Using Heatmaps to Understand Strategy Dynamics
For new traders, understanding the flow of a trading strategy can be challenging. The heatmap provides an educational insight into how different components of a strategy interact with market conditions.
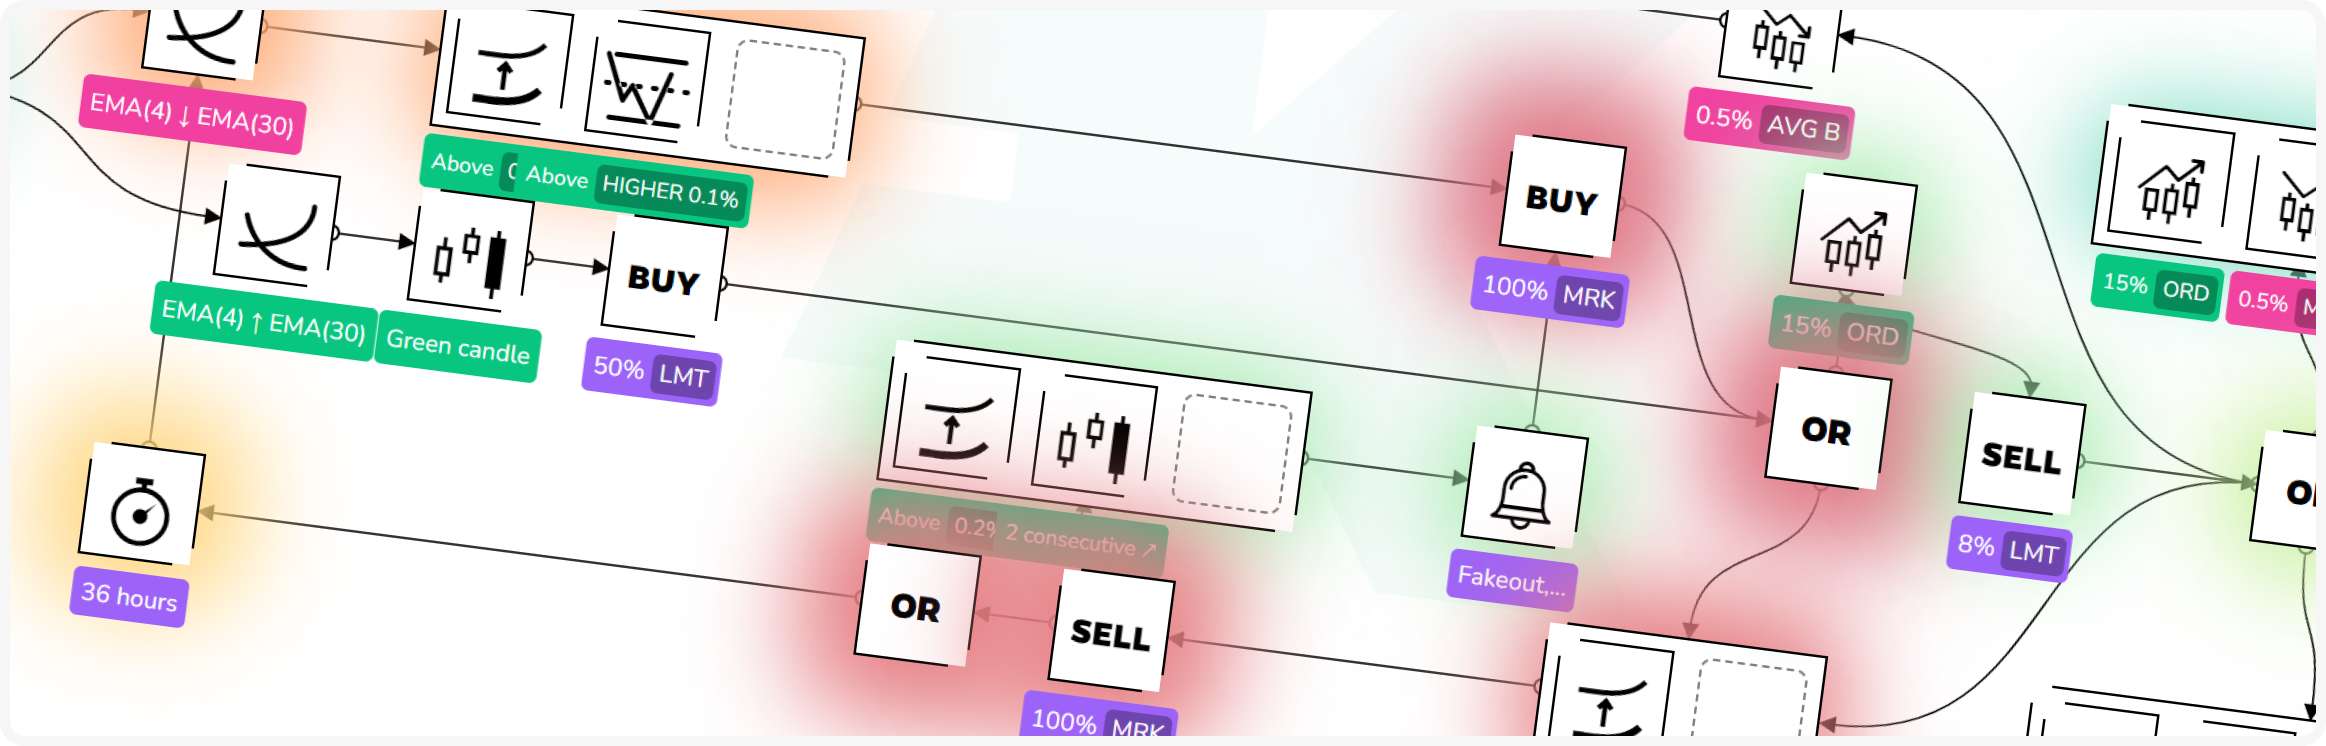
By providing a color-coded flow passages, users can quickly identify which parts of their trading strategy are most active and which are less utilized, making the bot's behavior easy to understand at a glance. This visual analysis can be crucial for optimizing strategies to improve performance by helping to identify the critical paths in a trading strategy, i.e. the sequences of actions that are most frequently taken, enabling us to understand which market conditions are most commonly encountered.
A/B Strategy's Behavior Testing
By running successive backtests with slightly modified parameters, traders can use the heatmap to compare the paths taken and assess which modifications have the greatest impact on the strategy's behavior.
Heatmap as a Diagnostic Tool: Debugging Trading Strategies
If a strategy isn't performing as expected, the heatmap can serve as a debugging tool, revealing the flow of trades and decisions within the strategy, helping to pinpoint issues.
Traders can analyze the heatmap to identify bottlenecks or areas where blocks might be underutilized or not used at all as well as detect unexpected behavior within their strategy, which is crucial for maintenance and continuous improvement. By adjusting these blocks, users can ensure that the trading bot works properly.
Diversifying Trading Signals for Strategy Enhancement
If the heatmap shows that certain parts of the strategy are overused, this may indicate a lack of diversification in signals. Traders can then look to integrate other types of signals or indicators.
Managing Inconsistency and Volatility in Trading Strategies
If certain blocks are activated inconsistently or sporadically, this could indicate that the strategy is reacting badly to market volatility. Traders can see this on the heatmap, and adjust these blocks to better manage periods of high volatility.
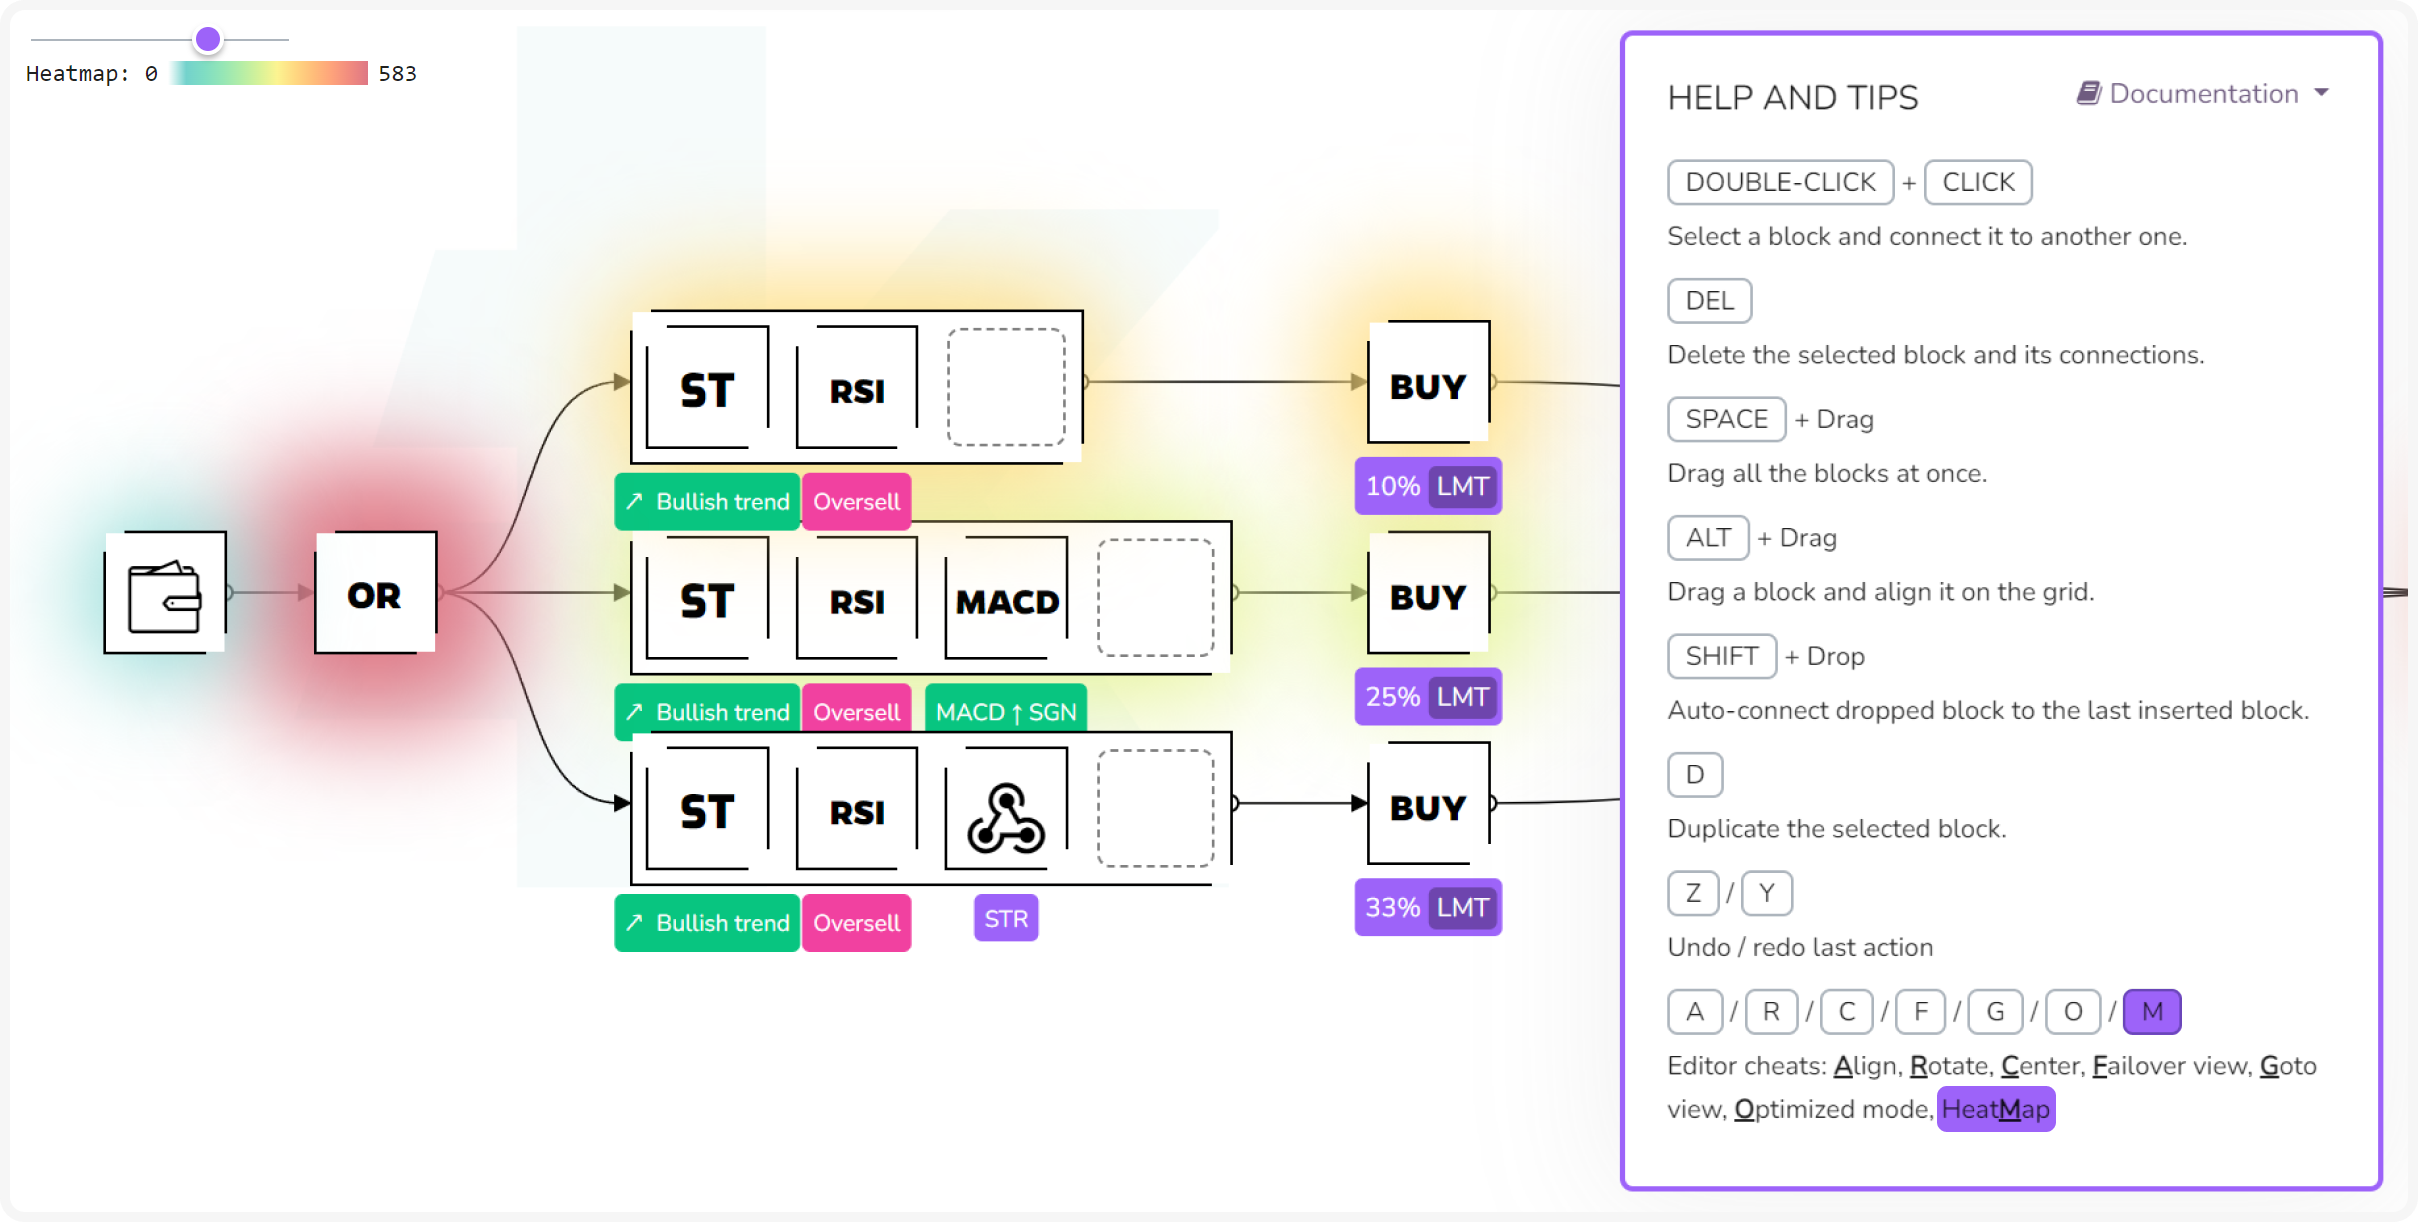
How to Activate the Heatmap in the Kryll Editor?
Simply press the M key on your keyboard to activate the heatmap in the Kryll trading bot editor. This information can be found in the help window (H), along with other keyboard shortcuts you may find useful.
How to Interpret Heatmap Data?
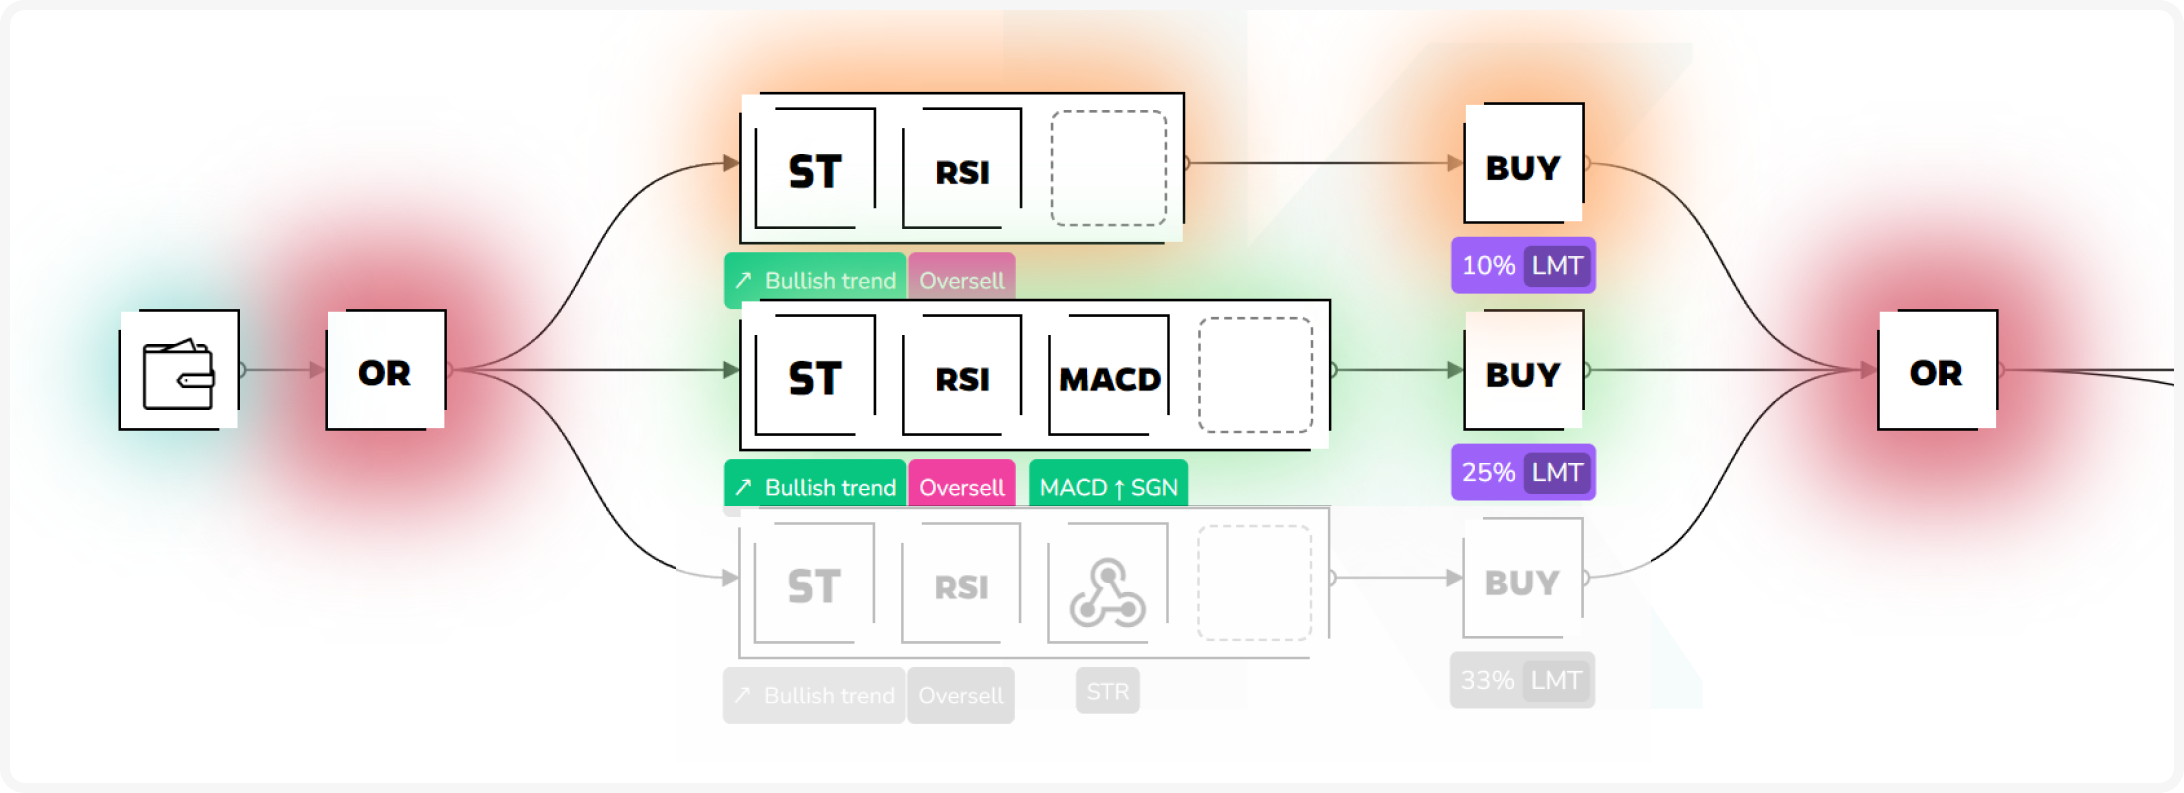
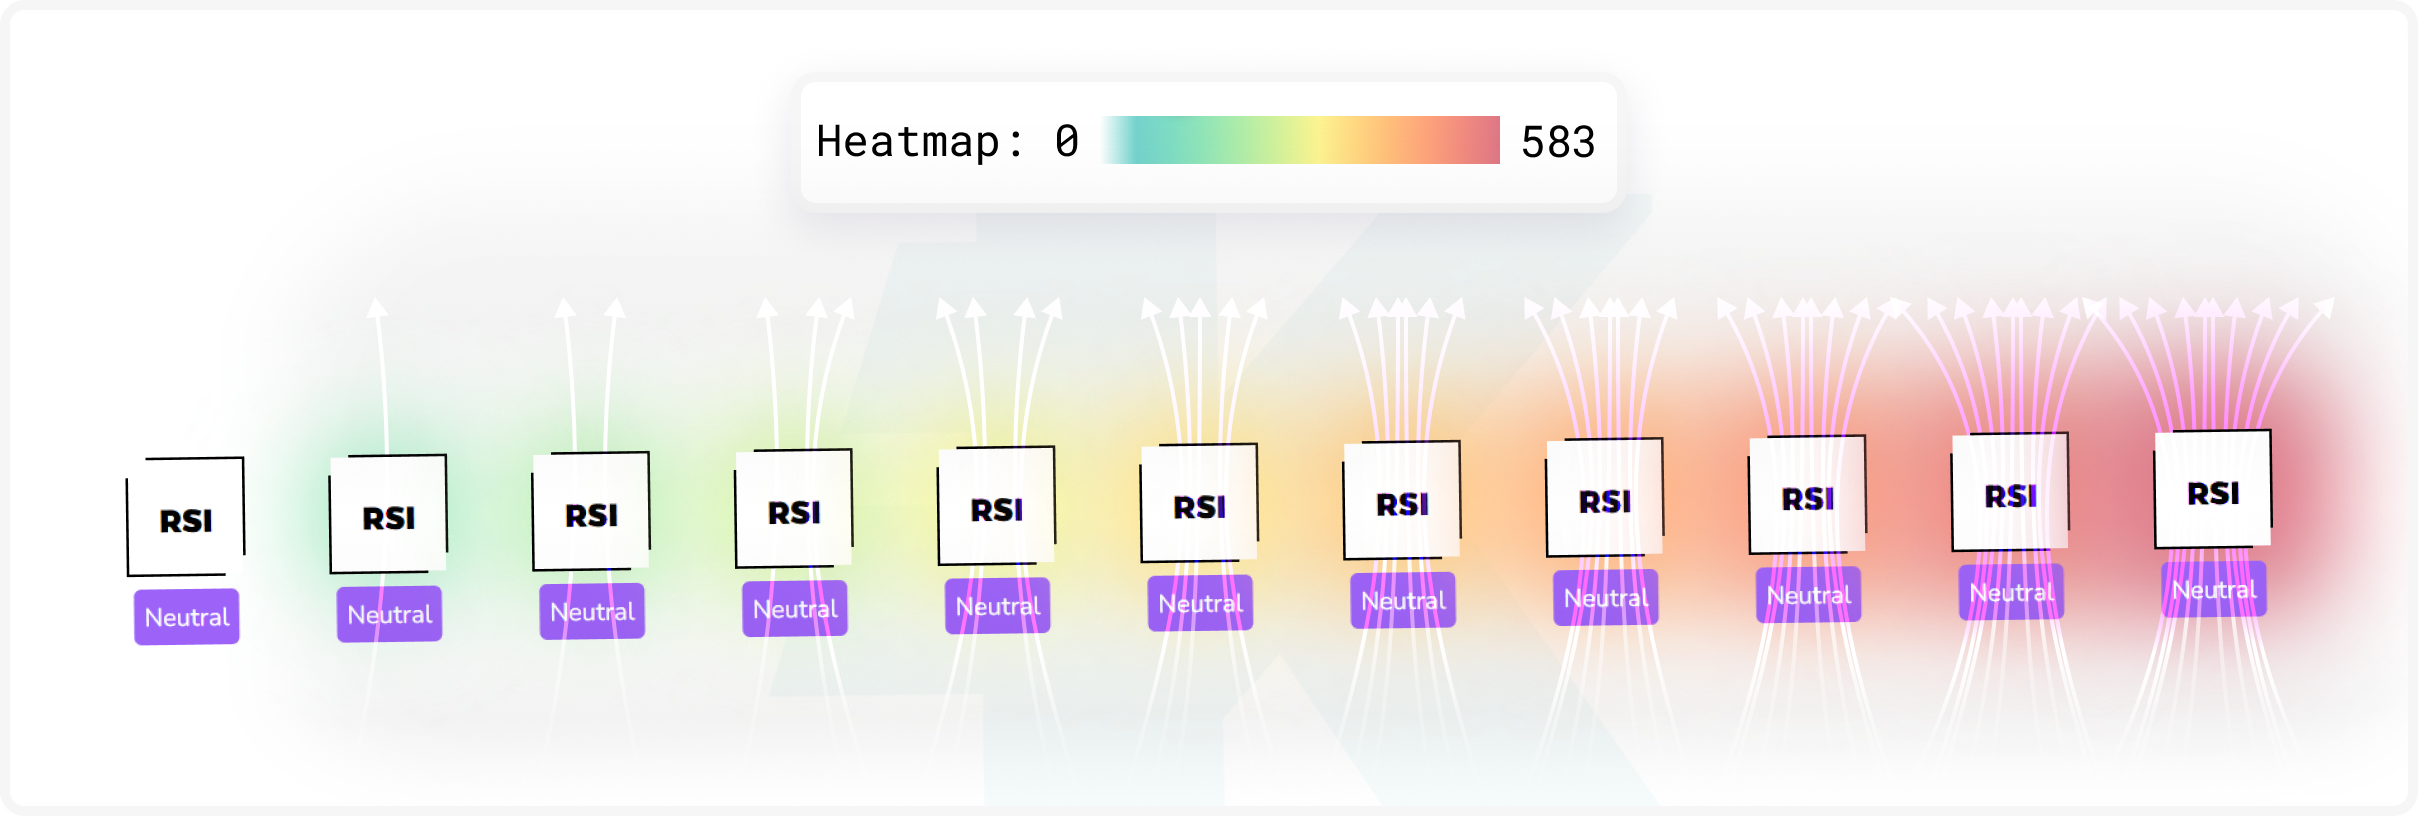
The heatmap in the Kryll editor is a graphical tool that allows traders to see which parts of their trading strategy are most in demand. Think of it like a heat map showing areas of activity: the more a block is used, the hotter its color will be. Blocks that have no color indicate that they have not been used at all, meaning that in the context of your strategy, these conditions or actions have not been encountered or triggered. At the other end of the spectrum, blocks that display a red color indicate that they have reached the highest level of activity possible within the current context of your strategy. If you see blocks with intermediate hues, such as green or yellow, this shows that they have been activated a moderate number of times. This visual tool is therefore essential for optimizing strategies by highlighting the most and least active elements of your trading.
Final Thoughts: Embracing the Heatmap Revolution
The heatmap is more than just a feature; it's a transformative tool for workflow analysis that adds depth and nuance to the trading strategy development process on the Kryll platform. This advanced functionality brings a new dimension of clarity to the trading bot creation experience, allowing users to visually decode the behavior of their strategies. We are excited to see how our users will leverage this dynamic feature to enhance their trading bots. Dive into the Kryll editor, activate the heatmap with a simple keystroke, and start discovering the invaluable insights that can redefine your approach to automated trading. Your next level of trading strategy optimization awaits!

Happy Trading,
Website: https://kryll.io
Twitter: @Kryll_io
Telegram EN: https://t.me/kryll_io
Telegram FR: https://t.me/kryll_fr
Telegram ES: https://t.me/kryll_es
Discord: https://discord.gg/PDcHd8K
Reddit: https://reddit.com/r/Kryll_io
Facebook: https://www.facebook.com/kryll.io
Support: support@kryll.io