

Candle pattern block - This block is a "conditional block" that is triggered when it detects a specific candle pattern (or a defined family of patterns).
Block configuration
In the block parameters you can select the time unit you want to study and the pattern to detect:
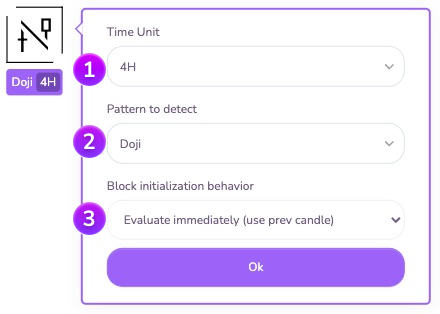

Analysis period: Here you choose the time unit that will be used to analyze the candles and detect the selected pattern.

Type of Pattern : You select here the pattern to identify. At each candle closing, the block will try to identify the pattern and will be validated if the pattern is identified.
Here are the types of patterns/patterns available:
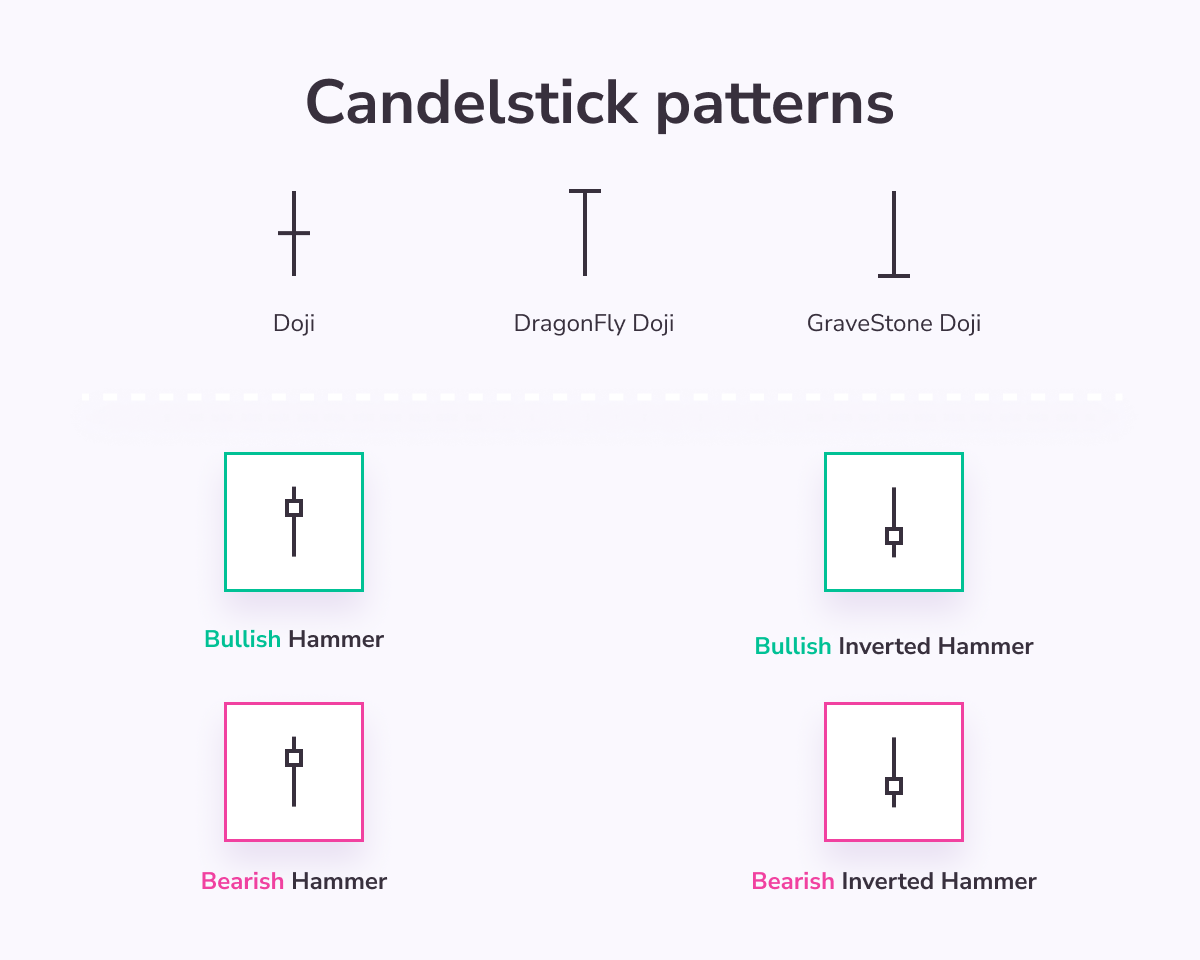
Note : Any Bearish Pattern and Any Bullish Pattern means that any form of bearish (reddish background) or bullish (greenish background) trends will trigger the block.
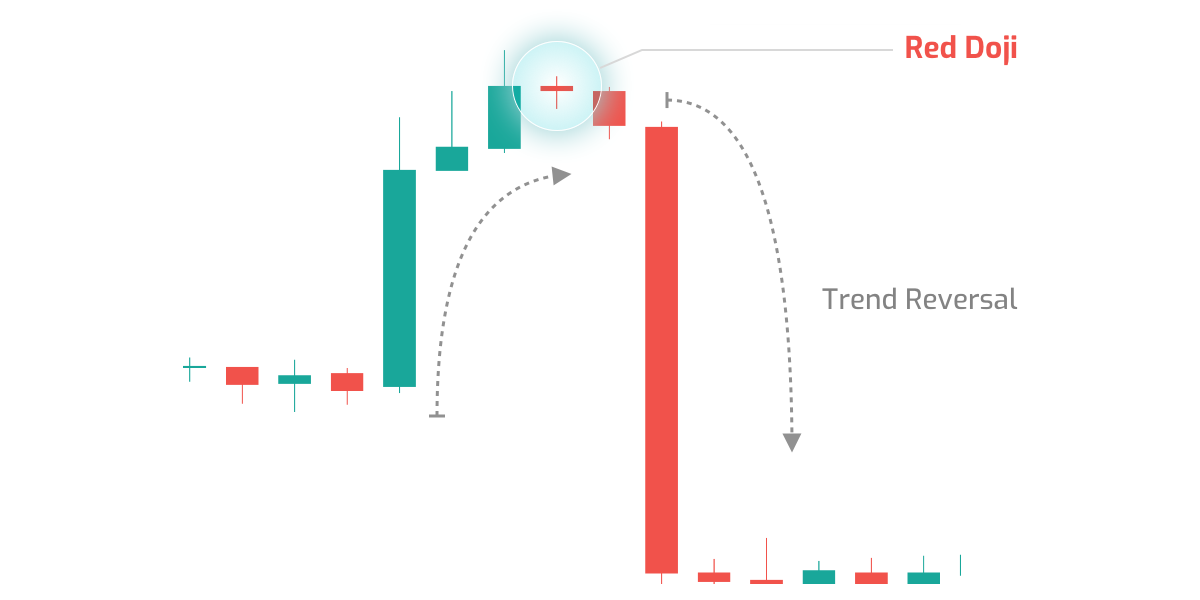
There are many guides online on how to use candle patterns, as each one has its own particularities. These patterns are not "buy" or "sell" signals as such, it always depends on the situation in which the pattern occurred.

Behavior at initialization: Here you can define the behavior of the block at its initialization. You can either wait for the current candle to close (option "Wait for next close"), or instantly evaluate the block conditions on the last closed candle (option "Evaluate immediately"). This last option is particularly useful to perform analysis on several time units in parallel or to analyze an indicator on a macroscopic time unit (12H / Daily / Weekly...) without blocking the strategy by waiting for a candle to close.
Together it's better!
Complementary, the two candlestick analysis blocks can be used successively: you can indeed detect a "doji" after a succession of "x" green candlesticks, in order to confirm a trend reversal.
You can also use them together in an AND block to detect the color of the Doji / Dragonfly Doji / Gravestone Doji because it can have a different meaning depending on the color.
It's up to you to adapt your blocks to the market now that you have all the tools in hand to succeed!
As usual, we strongly advise you to combine signals before taking a position in a strategy and to avoid using only one type of indicator.
Join us on our Telegram and Discord groups as well as our other social networks to share your opinion and your feedback on the Kryll.io platform

Happy Trading,
Website : https://kryll.io
Twitter : @Kryll.io
Telegram EN : https://t.me/kryll_io
Telegram FR: https://t.me/kryll_fr
Telegram ES: https://t.me/kryll_es
Discord : https://discord.gg/PDcHd8K
Facebook : https://www.facebook.com/kryll.io
Support : support@kryll.io