
Understanding is the key
A good understanding of the result is mandatory to fine tune your strategy.
Buy&Hold Vs Your awesome strategy
The results performances are always compared to Buy&Hold. This mean that your strategy results are compared to a date where you would have bought 100% of your traded currency and waited until the end of the backtest period. This way you can easily know if your strategy is better than a Buy&Hold attitude. The Numbers in the left columns are for Buy&Hold and the numbers on the right column is your strategy results.
NUMBER OF TRADES:
This is the number of trades made on the exchange. This is a good way to have an idea of how much your exchange will charge you in fees, a lot of trade is not always a good thing.
STARTING CAPITAL:
This is the initial capital of your strategy. Both B&H and your strategy start with the same amount for an optimum comparison.
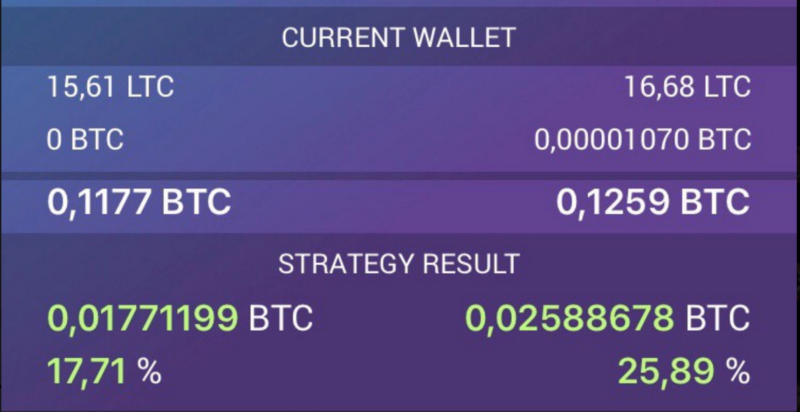
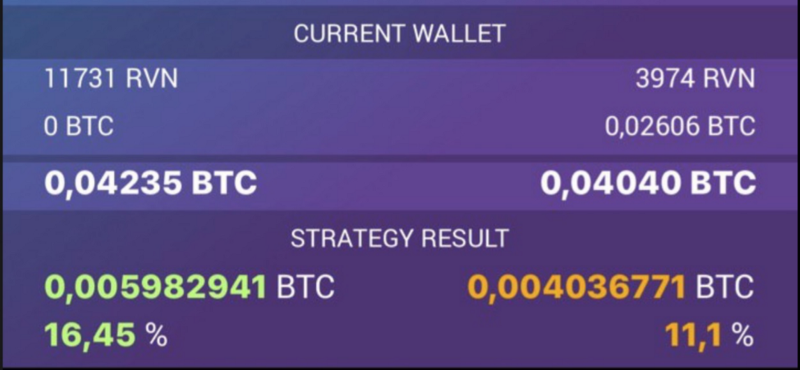
FINAL WALLET:
Everything have an end… This is the state of your strategy wallet (exchange fees taken into account). When you click on the “+” you’ll display the detail of your assets (ie: BNB and USDT) as you strategy may have not sold/buy all your traded currency, it can be splitted between your traded pair.
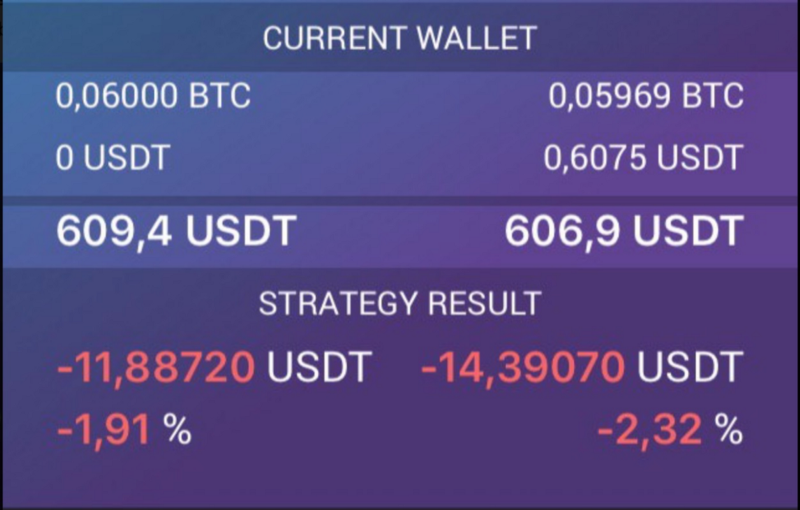
STRATEGY RESULT:
Here you will find the raw results of your strategy. in our example if you had Hodl you would have lost -8.6% of your initial capital (-86 USDT) while your awesome strategy have performed about +27%! (+270 USDT).
PERFORMANCE ANALYSIS:
Maybe the most important numbers to check. These numbers are calculated on the difference between Buy&Hold final wallet and your strategy final wallet.
ie: 1,270.32 - 913.45 = +356.87 USDT which is +35.687% profits. Congrats!
My results are green but I’m loosing money, why ?
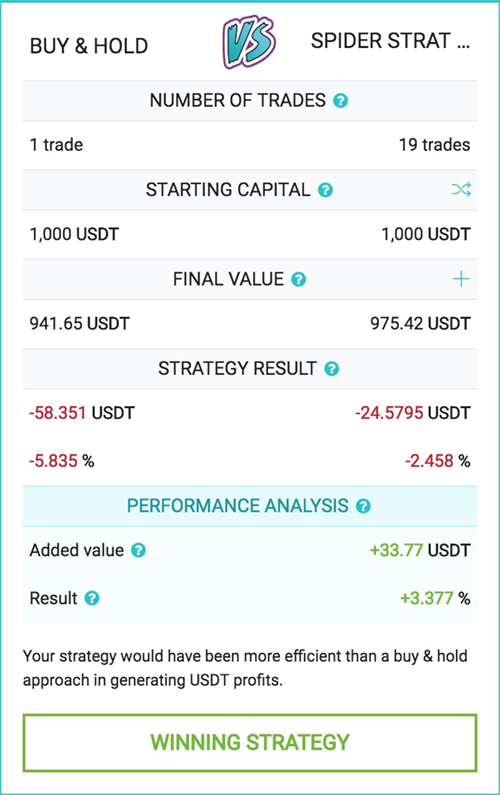
This mean your strategy would have won against a Buy&Hold . In this case you would have lost -24.5795 USDT with your strategy but you would have lost more by holding your funds -58.351 USDT.
What do colours represent?
The colors represent the status of the wallet in relation to the buy and hold.
- Green: your performance is better than Buy & Hold and it is positive
- Orange: your performance is worse than buy and hold but remains positive
- Red: your performance is worse than buy & hold
It’s your turn now !
Now we are counting on you to make the best strategies ever ! Don’t hesitate to send your screenshots on the discord chat, or the telegram chat !
Happy Trading!
Be sure to follow us on all our social networks.
Our website: https://kryll.io
Twitter : @Kryll.io
Telegram : https://t.me/kryll_io
Discord: https://discord.gg/PDcHd8K
Facebook : https://www.facebook.com/kryll.io