

StochRSI Block - This block is a "conditional block" that is triggered based on the behavior of the Stochastic RSI. This allows you to identify the entry into the oversold zone, the return to the neutral zone and combine this block with other indicators to make your decisions.
Reminder of the basics
The Stochastic Relative Strength Index (stochRSI) is an oscillator developed to take advantage of the two momentum indicators (stochastic indicator and RSI) to create a more sensitive indicator, tailored to the historical performance of a specific asset rather than a generalized analysis of price movements. It allows to put in perspective an instantaneous value of RSI compared to its highest and lowest over a given time interval.
It is composed of 2 values (K and D) which vary from 0 to 100. The K line represents all the RSI stoch values and the D line represents the moving average of the RSI stoch values.
Here is its calculation formula is StochRSI = (max[RSI]-min[RSI])/(RSI-min[RSI])
- RSI being the instantaneous value of RSI.
- max[RSI] is the maximum value of RSI observed on the configured length.
- min[RSI] is its minimum value on the same length.
For more information on this indicator, please visit Investopedia and to read Tradingview wiki tricks.
Block configuration
In the parameters of the block you can select the unit of time you want to study, its length (the number of candles studied) and the signal configuration you expect before moving on.
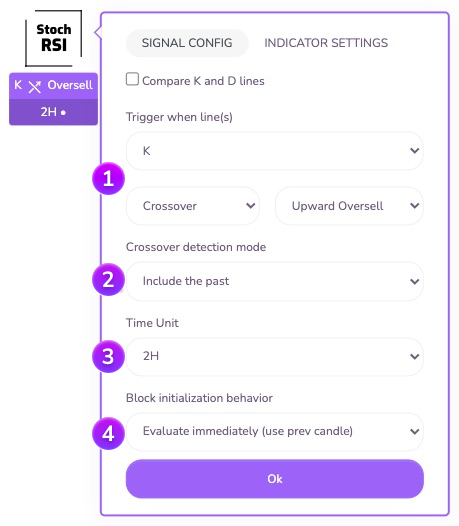

This first zone allows you to select the conditions that will trigger the block: Which line(s) to analyze and on which behavior to validate the block.
Activation when line(s): allows you to choose which line(s) will be used for the analysis of the block behavior: K, D or both.
Type of signal: Here you can configure the type of signal you want to wait for in order to trigger the block. It is thus possible to trigger the block according to the position of the RSI (its current state) or according to its behavior (passage from one zone to another):
- Position triggering: the block is triggered when the studied line(s) are located in the expected zone: Overbought (zone located above the overbought threshold, above 70 by default), Neutral (zone located between the oversold and overbought thresholds, by default from 30 to 70, limits included) and Oversold (zone located above the oversold threshold, below 30 by default)
- Triggering on crossing: the block is triggered when the studied line crosses from one zone to another in a well determined direction: it is thus possible to trigger the block when the line crosses the overbought limit upwards (passes from the neutral zone to the overbought zone) or downwards (passes from the overbought zone to the neutral zone). Same when the line crosses the oversold limit on the downside (goes from the neutral zone to the oversold zone) or on the upside (goes from the oversold zone to the neutral zone).
Note: when selecting the option both in the parameter "Activation when lines" the crossing mode is not available.

In crossover waiting mode, an additional option is available: the taking into account of the past. This option allows you to take into account (or not) the previous candles for the validation of the block during its initialization.
Example: Suppose you set up a block to detect an overbought crossing at 1am and the strategy arrives on this block at 5:30am. Let's further assume that the K line of the Stoch RSI crosses the overbought at the close of the candle (at 6am)
- the block configured for 'Include the past' will be triggered because it detects a crossing between the 5 o'clock and the 6 o'clock candle.
- the block set to 'Ignore the past' will not trigger because it will wait for a cross only from the 6 o'clock candle and will ignore the past state of the K line of the Stoch RSI.

You can specify the Time Unit on which you want the block to operate.

Behavior at initialization: Here you can define the behavior of the block at its initialization. You can either wait for the current candle to close (option "Wait for next close"), or instantly evaluate the block conditions on the last closed candle (option "Evaluate immediately"). This last option is particularly useful to perform analysis on several time units in parallel or to analyze an indicator on a macroscopic time unit (12H / Daily / Weekly...) without blocking the Postsstrategy by waiting for a candle to close.
Advanced configuration
Since the Stoch RSI is composed of 2 curves, it is sometimes appropriate to analyze their behavior in relation to each other. The option "Compare K and D lines" allows you to set up this type of analysis.
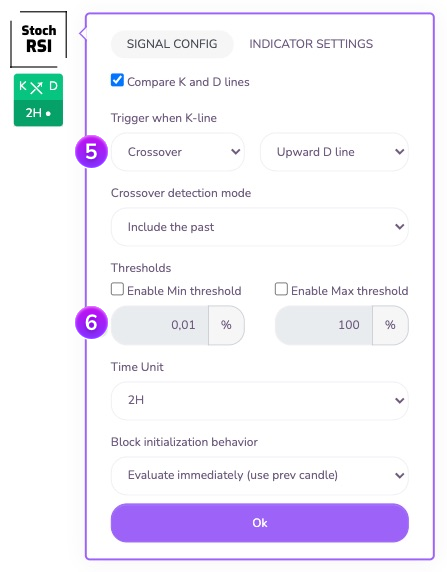

As for the Kryll blocks analyzing the lines, it is possible to trigger the block when a line is located in a position in relation to another one (above or below) as well as when they cross in one direction or the other:
Position will allow to set a condition on the position of the selected line in relation to the other (K above D for example).
Crossing allows you to set a condition on the crossing of the selected line with respect to the other (K crosses the line D from bottom to top).

In the case of the analysis between two curves, Kryll provides by default a set of threshold tools to erase false signals. These tools are available for the Stoch RSI block in the "Compare K and D lines" configuration
Minimum threshold: This threshold allows you to define the minimum percentage above which the block will validate the crossing or the position. It is thus possible to erase the "false signals" which can appear in period of range, when the curves cross frequently on very small variations.
Maximum threshold: This threshold allows you to define the maximum percentage beyond which the block will no longer validate the crossing or the position. It is thus possible to avoid validating a condition on movements of extreme amplitude or too late.
Configuration and failure points
If you want to change the default values and failure points of the Stoch RSI, you can do so here.
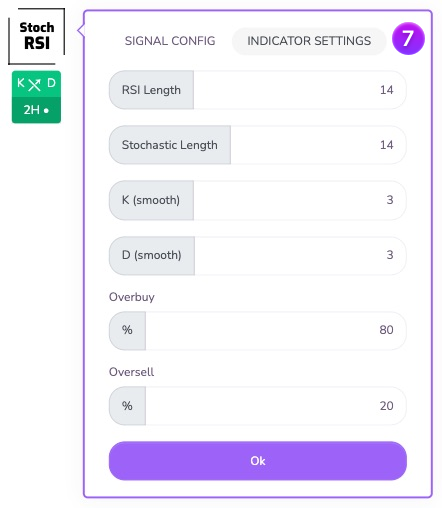

RSI length: allows you to configure the length of the RSI used to calculate the RSI stoch. Default value: 14
Stochastic length: allows you to set the length of the moving average used for the RSI stoch calculation. Default value: 14
K (smooth) is the time period used for the calculation of the K line.
D (smooth) is the time period used in the calculation of the line D.
Default value: 3
Overbuy allows you to specify the threshold above which the block will consider the instantaneous value in percent as being overbought. Default value: 80
Oversell allows you to specify the threshold below which the block will consider the instantaneous value in percentage as being oversold. Default value: 20
Do not hesitate to join us on our Telegram and Discord groups as well as our other social networks to share your opinion and your feedback on the Kryll.io platform.

Happy Trading,
Website : https://kryll.io
Twitter : @Kryll.io
Telegram EN : https://t.me/kryll_io
Telegram FR: https://t.me/kryll_fr
Telegram ES: https://t.me/kryll_es
Discord : https://discord.gg/PDcHd8K
Facebook : https://www.facebook.com/kryll.io
Support : support@kryll.io