

If you're into crypto, chances are you've probably had an acquaintance who adamantly claimed that there were indeed better days to trade or buy Bitcoin (BTC). For some, it's a specific day of the week, for others it's the weekend... It may have made us smile at some point, but have you ever seriously wondered if certain days are more conducive than others to trading Bitcoin?
What is the "Weekend Effect" in traditional finance?
In the world of traditional stock market investment, it is well-documented that certain days of the week are generally more profitable than others. For example, the "Weekend Effect" is a market phenomenon that suggests that stock returns on Monday are often lower than those of the preceding Friday. Companies often tend to "bury" bad news by releasing it on Friday evenings, after the market closes.
Although the cryptocurrency market never sleeps, has the same "day bias" crept into the digital asset markets? Do the rules of traditional finance apply to Bitcoin and altcoins? Is buying coins and other tokens on Monday and selling them before the weekend a winning strategy? What are the "day of the week" axioms that govern the crypto market? Let's try to answer the question factually and with numbers.
Correlation between BTC and Financial Markets
What is Bitcoin?
For those who happen to come across this article and are unaware, Bitcoin is a decentralized digital asset (cryptocurrency), free from government regulations and central banks, which relies on blockchain technology for secure and transparent transactions. A pioneer, it has sparked a global revolution, challenging traditional financial systems.
What are the peculiarities of crypto markets?
Unlike traditional markets, Bitcoin is decentralized which means it is not dependent on any government, company, or centralized institution (bank, exchange). It is traded 24/7 globally and these unique characteristics give rise to its own patterns and trends, forming a separate universe from traditional finance, with its own market dynamics.
In the world of cryptocurrency, Bitcoin is often used as a proxy for the entire market, as it largely dictates the price movements of most altcoins over time. However, despite the similarity to traditional financial markets, it remains to be seen if the "Weekend Effect" also applies to cryptocurrency.
What are the relations between Bitcoin and Traditional Markets?
Even though Bitcoin is often considered a "safe haven" asset during economic crises, similar to gold in the traditional market, the correlation between Bitcoin and traditional financial markets has varied over time. For example, during the financial crisis caused by the COVID-19 pandemic in 2020 or during the war in Ukraine in 2022, Bitcoin and traditional financial markets showed correlation, both dropping at the same time. However, this correlation is not constant and can vary depending on market conditions and other external factors.
So the question still remains:
Is there a "best day" to buy Bitcoin?
Understanding Price Dynamics During the Week
The temporal dynamics of cryptocurrency prices are an essential facet of understanding the behavior of the cryptocurrency market. These dynamics are influenced by a number of factors that we could initially analyze.
What is the Impact of Psychology on the Crypto Market
Market psychology plays a crucial role in the fluctuations of cryptocurrency prices. Market sentiment can vary from day to day, with each day bringing a different dynamic.
For example, Monday is often seen as a day of enthusiasm and vigor, where traders return after the weekend, ready to invest and take risks. This sentiment can lead to an increase in cryptocurrency prices.
On the contrary, the middle of the week, such as Wednesday, can often be marked by a decrease in trading activity. Traders could be less inclined to take risks, which could lead to a decrease in cryptocurrency prices.
These trends are not absolute and can be influenced by a multitude of other factors. However, it is important to understand that prices are largely driven by humans (news of all kinds, general enthusiasm, fatalism, state of rest...) and understanding this can help explain the uneven price fluctuations from day to day.
Is there a weekend effect in Crypto trading?

As previously discussed, the weekend effect is a well-known phenomenon in traditional financial markets, where trading activity tends to significantly decrease over the weekend. This is mainly due to the fact that many financial institutions and exchanges are closed during the weekend.
In the world of cryptocurrency, however, trading is open 24/7. Cryptocurrencies are decentralized and not tied to a particular exchange, so they can be traded at any time.
This means that the behavior of the cryptocurrency market can vary considerably from the traditional market over the weekend. In fact, even though many actors and individuals tend to pause trading over the weekend, the majority of the volume (over 60%) remains present on Saturdays and Sundays.
It is therefore reasonable to think that if a "weekend effect" exists in the cryptocurrency market, it differs significantly from that observed in traditional financial markets.
The Impact of Global Time Zones on BTC
Unlike traditional financial markets, the cryptocurrency market is open continuously. As a result, cryptocurrency trading can be influenced by global time zones.
For example, an increase in trading activity in Australia on Monday morning may coincide with lower trading activity on Sunday evening in America. Similarly, an increase in trading activity in Asia in the morning may coincide with nighttime in Europe, which can result in price variations.

It is generally accepted that Asian trading zones are mostly bearish, while American or European trading zones are bullish. Indeed, the market is divided into three peak activity periods: Asia, Europe, and North America. A thorough analysis of the impact of these trading zones on bitcoin prices since January 2019 reveals that the average hourly return rate in the American market was 0.25%, while the average return rate in the Asian market was -0.08%.
Another factor to consider is that Bitcoin miners are mainly concentrated in the East. These miners need to sell their own bitcoins to support their activity, which can lead to a price drop in Asian trading zones. There are relatively few miners in the United States, so the American market sees fewer sales, which may also explain the positive returns.
Is there a more profitable day than others?
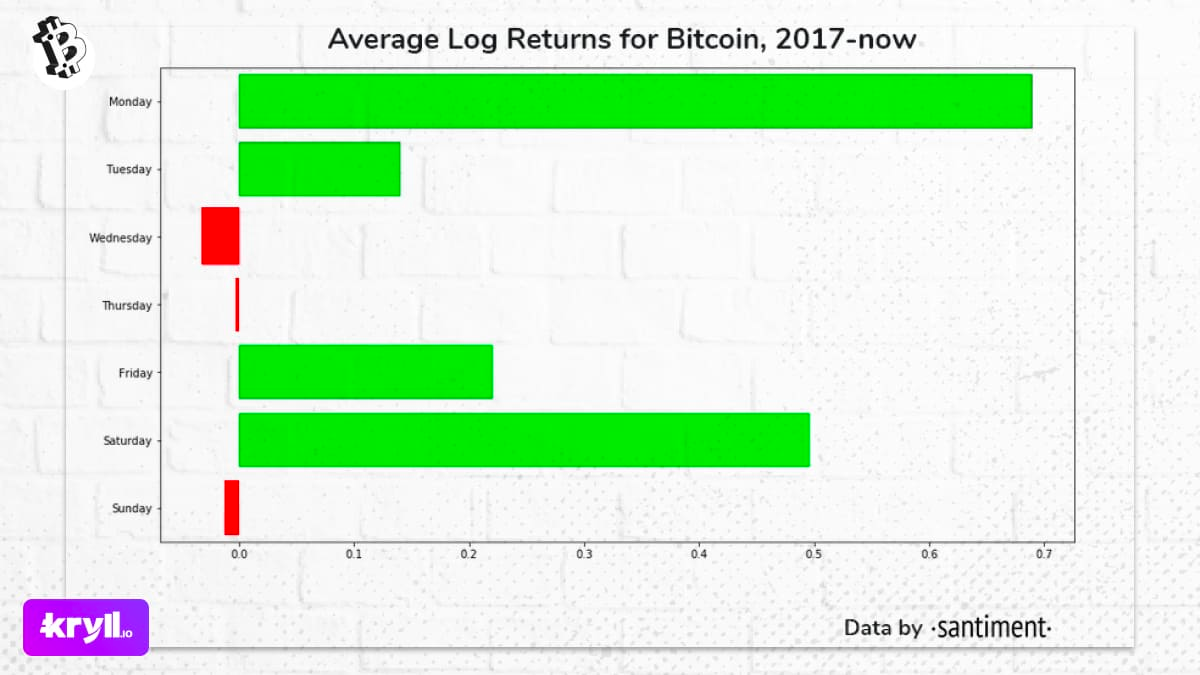
Santiment's article, "Backtesting the week: Which days are best for trading crypto?", explores the concept of a trading strategy based on the days of the week for Bitcoin and other cryptocurrencies. This concept is based on the idea that there is a "day-of-the-week bias" in the cryptocurrency market, similar to what is observed in the traditional stock market.
The article examines the average returns of BTC for each day of the week since 2017. It was found that Monday and Saturday were the most profitable days, with average returns of +0.69% and +0.5% respectively. On the other hand, Wednesday was identified as the least performing day.
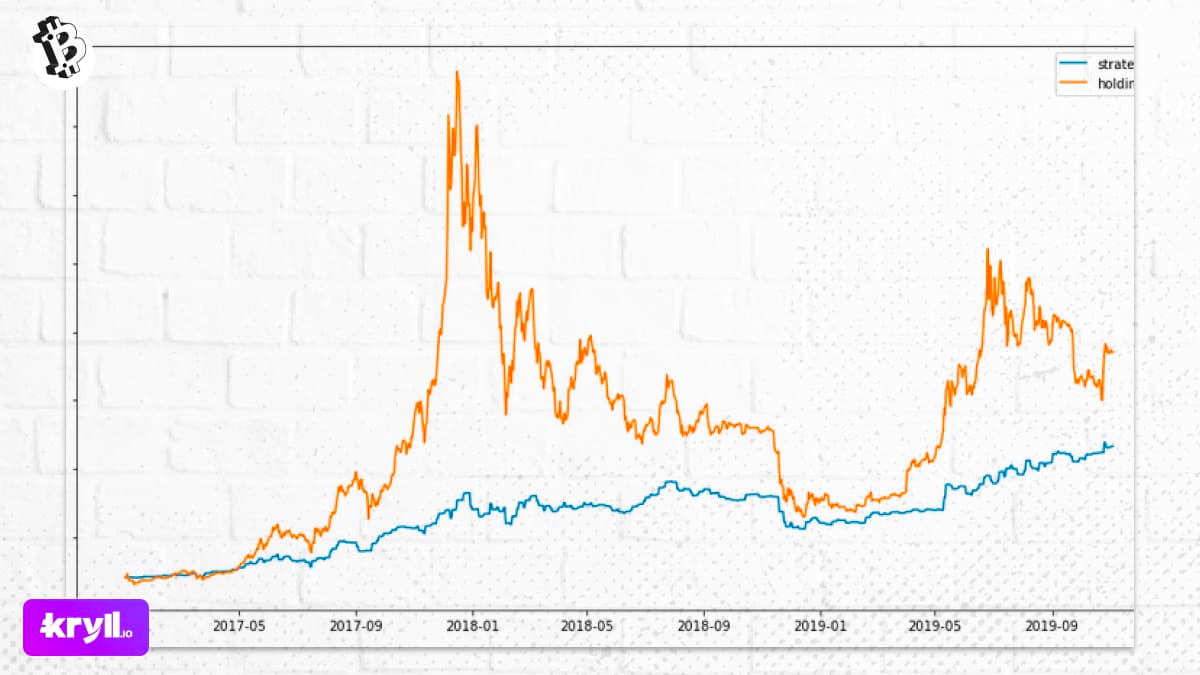
A strategy that beats Bitcoin HOLD?
These research studies based on daily Bitcoin returns have shown that certain trading strategies based on the day of the week could surpass a long-term investment strategy, such as "hodling" (long-term holding of Bitcoin), in certain contexts. For example, the study demonstrated that a strategy of buying Bitcoin only on Mondays and Saturdays and selling it at the end of the day would have generated a profit of 68% between 2018 and 2019, while hodling would have resulted in a loss of about 38% over the same period.
To avoid hindsight bias, the article also tested the strategy from 2018 using data from 2016 to 2017. The results of this simulation were also promising, with a slight loss of -4% compared to a loss of -38% for HODL.
However, when applied over a longer period (for example, starting from 2017), this strategy would not outperform HODLing's performance, but it would significantly reduce volatility and thus improve the gain/risk ratio.
Let's reproduce the experiment

To validate and refine this experiment, we first decided to reproduce it. Having access to all Bitcoin market data since 2015 on Kryll.io, we attempted to confirm the results of this analysis and verify its scientific rigor.
It is essential to consider the purchase and sale fees in order to obtain an accurate picture of the actual daily trading return. Indeed, platforms such as Binance or Bybit charge commissions for each transaction. For example, Binance charges a commission of 0.1% when buying or selling BTC. Each transaction results in a loss of 0.1% of the value when buying and an additional loss of 0.1% when selling. At other exchanges, my fees can quickly weigh down the results, with Coinbase, for example, taking between 40bps and 60bps (0.4% and 0.6%) for a basic account (0-10k$).
To avoid any bias in our calculations, we must integrate these fees into our daily performance calculation formula:
perf = ((close * 0.999) - (open * 1.01)) / open
The first thing we notice when reproducing this experiment is that our results differ slightly from those of Jan.S (the author of the article). This difference can be explained by the fact that we use a different exchange platform than him and/or that the analyzed time range is not exactly the same. Nevertheless, we obtain a fairly similar image, with Monday and Saturday as ideal performance days.
Is this phenomenon still valid in 2023?
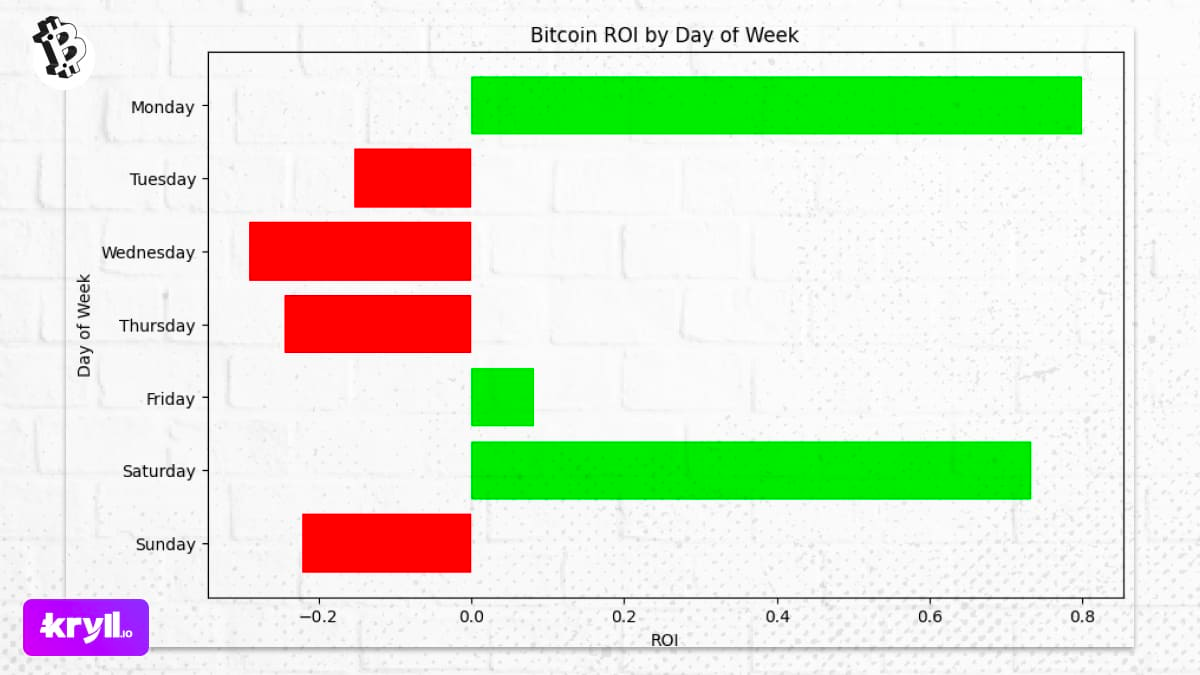
As with any trading or investment strategy, past performance does not guarantee future performance. It is therefore interesting to look at what has happened over a longer period of time. With this in mind, we have extended the analysis until June 2023. Here's what we can observe:
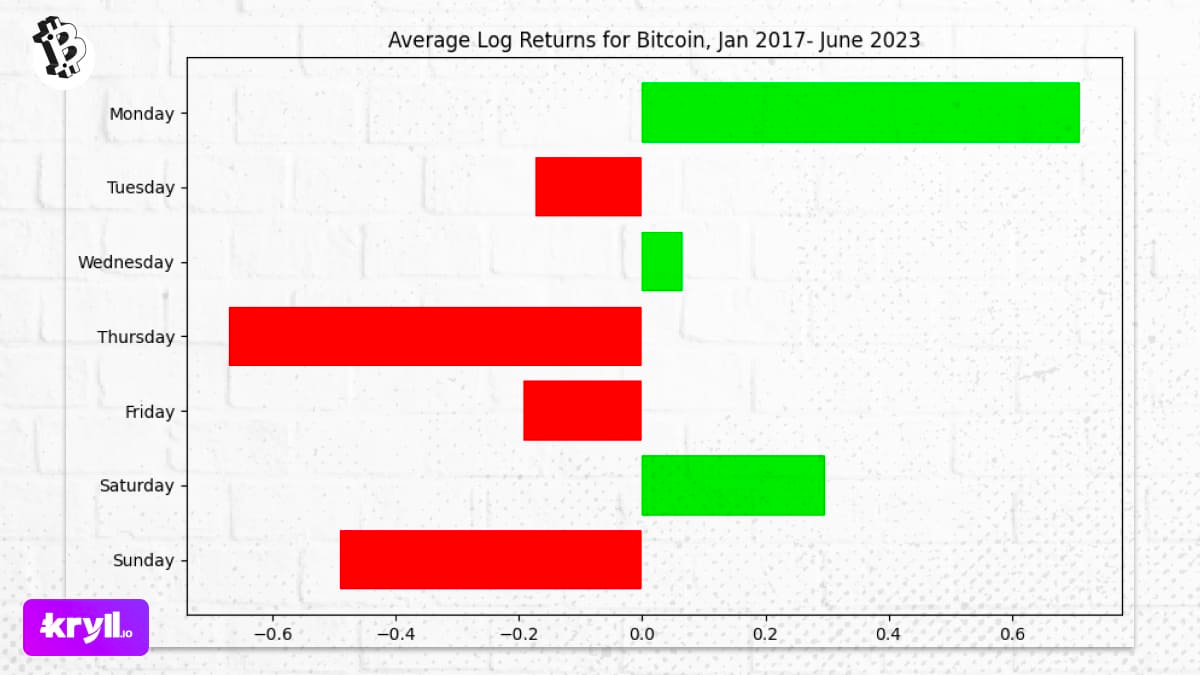
The first thing that strikes us is that Monday and Saturday remain the most profitable days. However, it is observed that Saturday has lost a large part of its performance and that Monday has decreased from an average RoI of 0.8% to 0.71%. This suggests losses during the years 2020 to 2023. It is also noted that Wednesday has returned to profitability despite its very poor performance between 2017 and 2019. But how can these movements be explained? Are Monday and Saturday still winning days?
What has changed with Bitcoin between 2020 and 2023?
To understand these differences, it is interesting to see what happened only during the period from November 6, 2019 to June 22, 2023.
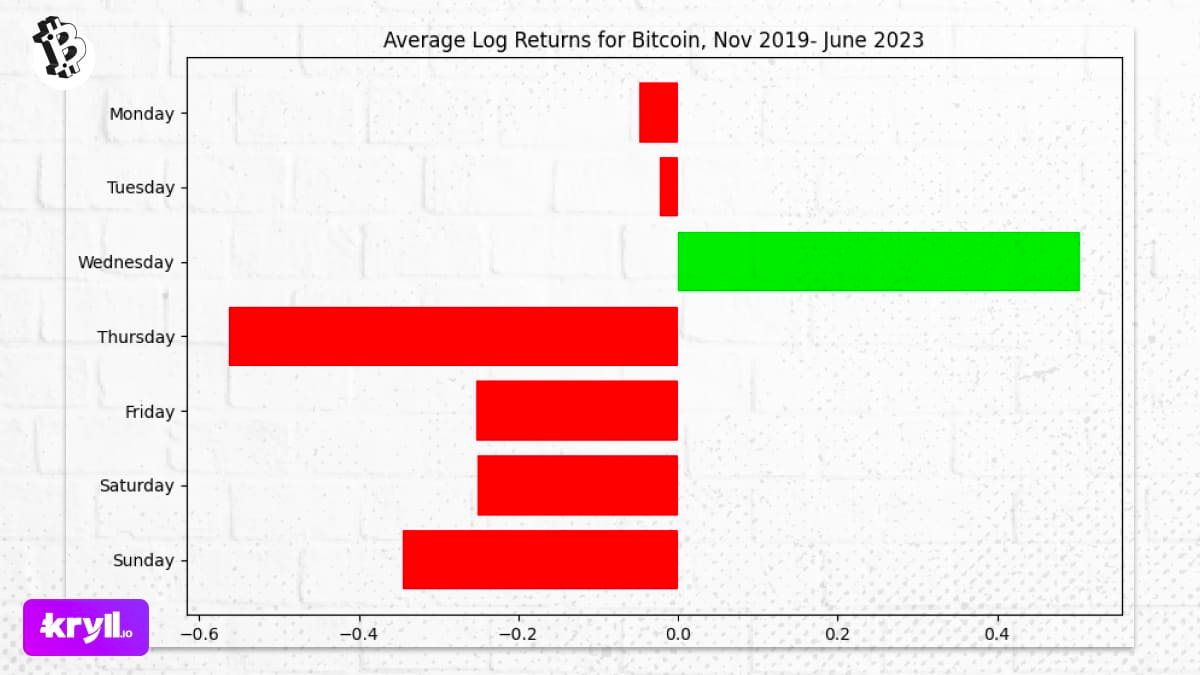
The first thing we notice here is that Monday and Saturday have completely disappeared from the chart as "winning" days. However, they still appeared on the previous chart (entitled "Daily BTC Returns between January 1, 2017 and June 22, 2023") as "winning" days during that period. But this was no longer the case between 2020 and 2023...
We then realize a first problem in the approach of this type of study: the use of "average return" over such a large period as 2017-2023 allows us to have an idea of the days that stand out on average, but it introduces an important problem, that of the distribution of results.
What are the Biases of this type of research?
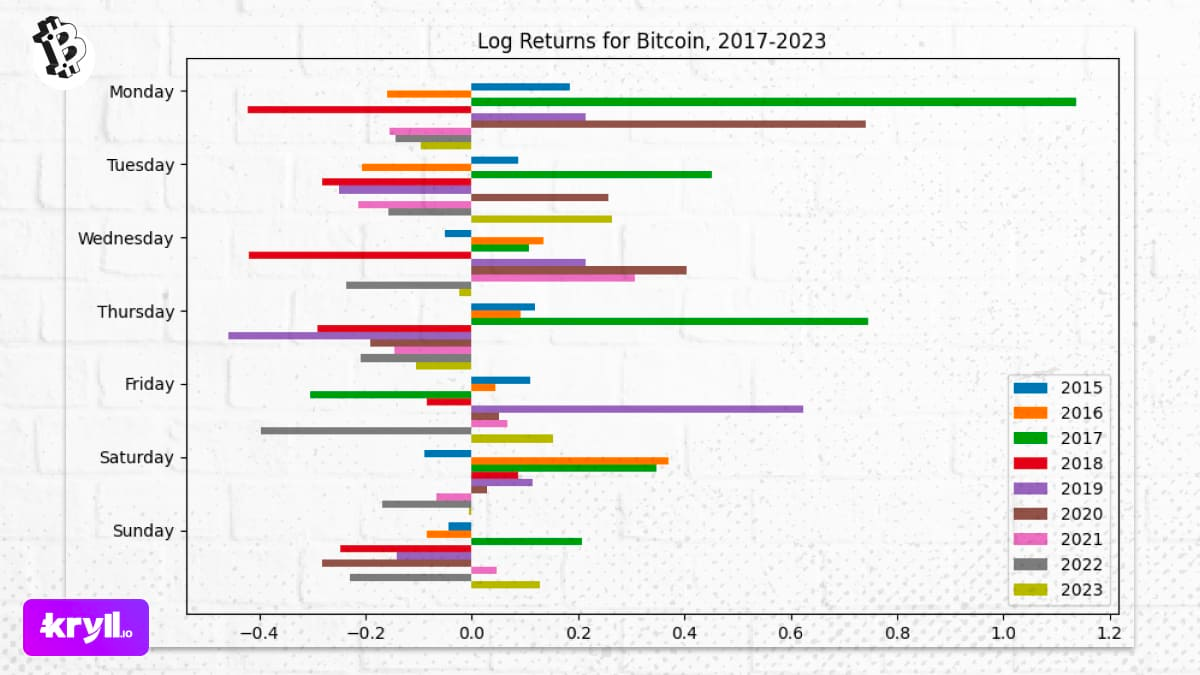
The first bias we observe is the commonly observed phenomenon in finance, called "survivorship bias". In other words, the performances of the first years can overshadow more recent performances due to their numerical importance. In our case, Monday's performances in 2017 have a considerable impact on the rest of the analysis and bring Monday's average return to 0.8%, even though it only occurred once more in 2020.
Another source of bias could be the "event bias". In the context of cryptocurrencies, important announcements or unexpected events can lead to huge price fluctuations in a very short time. For example, a cryptocurrency regulation announcement by a major country or the hacking of a major cryptocurrency exchange could result in a sudden drop or rise in price. These one-time events can significantly bias averages, particularly in a volatile market like cryptocurrency. They can make certain specific days exceptionally good or bad, regardless of what the 'normal' return for that day would be. These biases can lead to an overvaluation or undervaluation of the actual performance of a trading strategy based on weekdays.
Finally, another bias could be the "time bias" or "study period bias". This bias occurs when the chosen time period for the study may influence the results. For example, an analysis of Bitcoin's performance over a specific period of time may not be representative of its performance over other periods of time. The Bitcoin market, just like other financial markets, is constantly evolving and transforming. Factors that influenced the price of Bitcoin in 2017 may no longer be relevant in 2023. New regulations, the emergence of new blockchain technologies, and changes in public and institutional perception or adoption of Bitcoin have undoubtedly had a significant impact on Bitcoin's performance on weekdays.
In our specific case, it is possible that the importance of Monday and Saturday has diminished due to the growing adoption of Bitcoin by institutions. While Bitcoin was mainly traded by individuals in 2017, the situation has radically changed between 2020 and 2023, with an increasing number of companies and financial institutions showing interest and investing in Bitcoin, mitigating the traditional "Weekend" effect on the crypto market.
An ideal day for trading Bitcoin, a market myth?
In light of previous analyses, it seems clear that the reality of the market does not lend itself to simplistic generalizations. Thus, the notion that there exists an "ideal" day to buy and sell Bitcoin does not seem to hold up, at least not consistently over a long period of time. Indeed, our investigation tends to demonstrate that trends evolve over time, subject to a variety of factors ranging from regulations to technological developments, to changes in perception and adoption of cryptocurrency.
However, our analysis has revealed an interesting aspect: since 2018, Thursday seems to be the day that most often sees negative performances on Bitcoin. This discovery also confirms other analyses that had already identified Thursday as the most volatile day for Bitcoin in 2020, before the 2021 Bullrun and the Bearmarket of the last two years.
This could suggest a certain periodicity in market volatility, and even though it should be remembered that past performance is not a guarantee of future performance, there may be a way to profit from it.
So, when are we buying Bitcoin?

To answer this question, we will first look at a well-known trading strategy: Dollar Cost Averaging (DCA)
DCA is an investment strategy that involves dividing the total amount to be invested into equal portions and investing these portions at regular intervals, regardless of the price of the asset at that time. In other words, instead of trying to time the market to buy at its lowest level, you invest a fixed amount at regular intervals, such as every week or every month.
Now, referring to our previous analyses, it seems that Thursday is often a day of negative performance for Bitcoin. This means that the price of Bitcoin tends to be lower on Thursdays. If this trend continues, then buying Bitcoin every Friday morning could be a good idea. Indeed, if the price of Bitcoin is generally lower on Thursdays, it could still be at a relatively low level on Friday morning, which could allow you to buy Bitcoin at a lower price.
However, it is important to note that this approach relies on the assumption that the observed trend in the past will continue in the future, which is not guaranteed but would be interesting to test this approach.
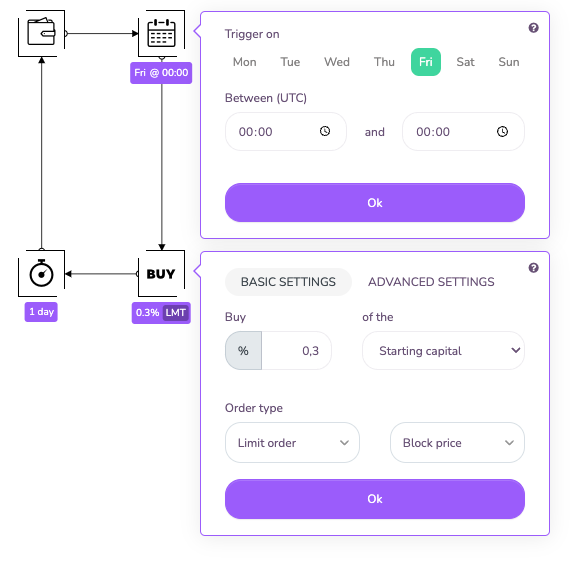
Thanks to Kryll.io, you can easily create and test this type of strategy for free using the new Calendar block. This block allows you to trigger specific actions on a particular day of the week or to plan specific behaviors for your trading bot based on whether it's a weekday or a weekend. Kryll.io indeed has the best tools to quickly create this type of strategy and perform various analyses. With its free backtest with over 7 years of bitcoin price history at the minute and its visual editor, it only took a few minutes to replicate the experience.
In our case, we want to buy at the Thursday close (so Friday midnight UTC). Since we want to DCA every week for over 6 years, we will divide our capital into 313 equal parts (52.1786 weeks per year, for 5 years). We want to buy BTC every week for 0.3% of our initial capital. To do this, we will use a new option of the Buy block that allows us to buy a portion of our initial capital. To avoid errors with orders that are too small, we start with $5000 in capital and place $15 per order each week.
What do the results tell us?
After implementing and testing our weekly purchasing strategy, we obtained the following return on investment (RoI) for each day of the week:
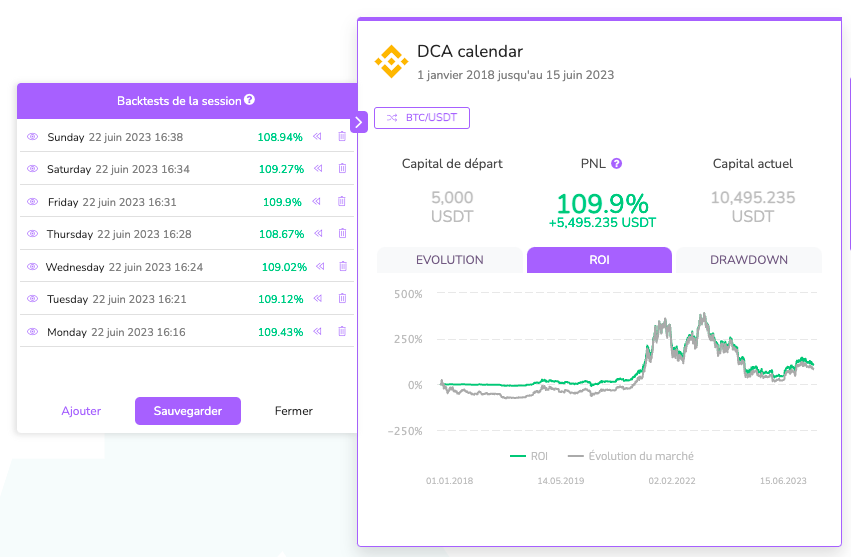
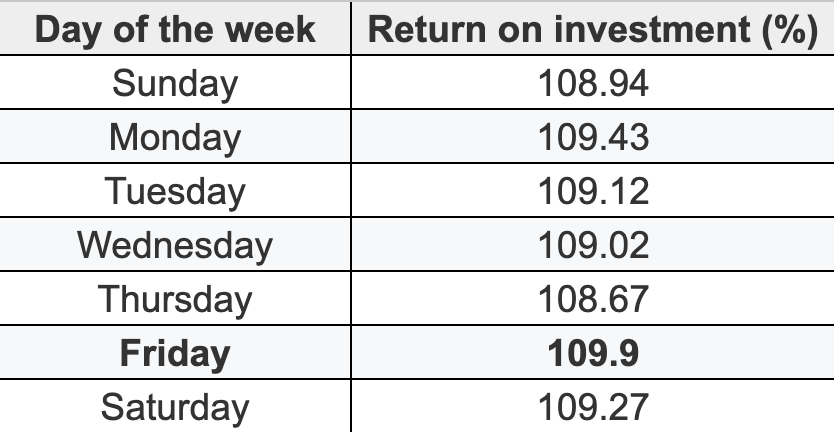
These results indicate that, for this specific period, buying Bitcoin on Thursdays, which had been identified as the day of the week when the price of Bitcoin tended to be the lowest, provided the lowest return on investment (ROI), with an ROI of 108.67%. On the other hand, Fridays provided the highest return, with an ROI of 109.9%, making it the "best" day to buy Bitcoin from an accumulation perspective.
These results demonstrate that the timing of investments can have an impact on returns, even though it remains difficult to grasp and control, and the final difference may be small.
What else have we learned?
The most important lesson to be learned is not to blindly trust studies done by others, including this one. Data may be outdated, various biases may be present, and nothing beats a personal approach to learning and improving. This is precisely why we created Kryll.io.
By using tools like Kryll.io, you can quickly create and test different strategies for free, then adjust your approach based on your own needs and goals. This approach can help you make more informed investment decisions and maximize your potential returns.

Happy Trading,
Website: https://kryll.io
Twitter: @Kryll_io
Telegram EN: https://t.me/kryll_io
Telegram FR: https://t.me/kryll_fr
Telegram ES: https://t.me/kryll_es
Discord: https://discord.gg/PDcHd8K
Reddit: https://reddit.com/r/Kryll_io
Facebook: https://www.facebook.com/kryll.io
Support: support@kryll.io