
Have you ever struggled, wondering how to improve your strategy? Have you ever tried looking at every single trade made on a one year long backtest, without finding any real information about where and why it went wrong?
Wait no more!
Released in a brand new fashion, loaded up, here comes the Deep Analysis by Kryll.io.
You can access it by clicking on the link at the end of a backtest, or simply import your log file here.
Okay, but what is it?
It's good to see if your strategy is winning or losing, but if you want to test it on longer periods of time, it gets harder to point out the flaws in your strategies. The Deep Analysis splits the timeline of your flow and spot the times when it went wrong.
So is it just a "strategy slicer"?
The Deep Analysis stands for much more than just slicing. You'll find a whole bunch o'tools and institutional indicators to help you evaluate your strategy and make the best out of it.
We at Kryll.io know that one can easily get lost in all these graphs and indicators. So, don't waste any time, fasten your belt and get ready to embark for a full tour of, you name it, the Deep Analysis!
Overview
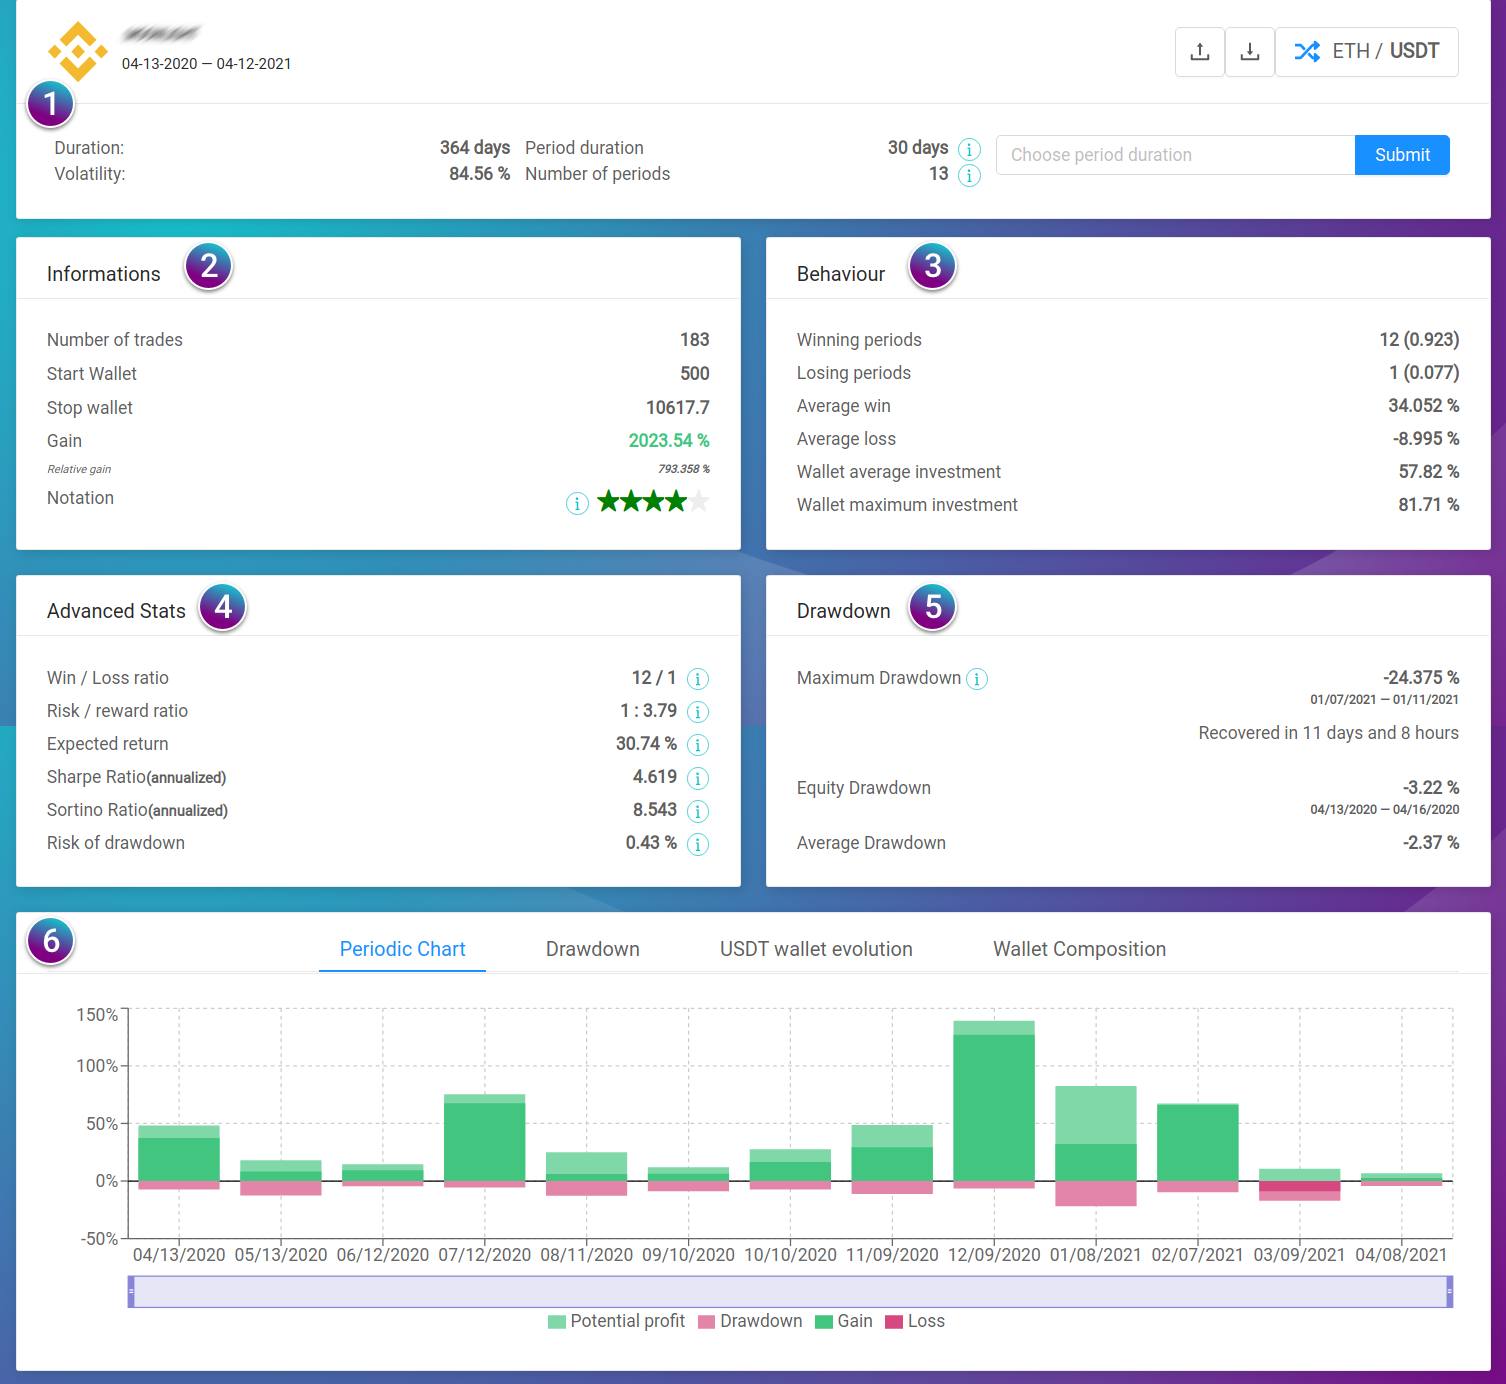
1- Global summary
Here, you'll find some general information about your strategy: its name, its pair, its duration. You can click on the pair to change the perspective of the analysis.
The volatility indicator shown here is helpful to understand how this particular pair is acting during the period of the backtest. It's calculated with the standard deviation of the pair's price. The higher that number is, the more unstable the pair is.
Then, the period duration and the number of periods tell you how the the backtest is divided. Here, we have 13 periods of 30 days.
You can change manually the period duration with the input box right to the side.
2- Informations
Now, we get to know how the strategy is doing!
The number of trades is self explanatory. The start and stop wallet are the value of the strategy's wallet at the beginning and the end of the backtest. This value will be calculated following the base or the quote of the pair.
The gain is what the strategy won or lost. The relative gain is the comparison with the buy and hold.
Based on multiple indicators that we'll see later, the notation give a grade to the strategy. It is mostly based on risk, it should therefore be interpreted not as a sign of an inherently bad strategy, but rather as a sign of a high risk strategy.
3- Behaviour
Do you remember the number of periods? 13, right? Now all these indicators are related to this number.
Winning and losing periods are calculated the same way as candles, with the open and the close, and we'll see more details about it when we talk about about the graphs.
The average win and loss are calculated only on winning and losing periods respectively.
The investment is the amount of the wallet in quote. It helps you see how the strategy handles your wallet.
4- Advanced Stats
Here is a heavy part.
Win / loss ratio: This is a recap on winning and losing periods.
Risk / reward ratio: Risking an amount on the strategy can lead to win XX times its value. The greater the better, if it's inferior to 1, the strategy is too risky.
Expected return: At the end of a period, this is the gain you can expect. If it's negative, you should be worried about the strategy.
Sharpe and Sortino ratio: These ratio are calculated using the deviation of the strategy's wallet. Sharpe uses the standard deviation whereas Sortino only take into account the downside deviation. This allows for a better evaluation of the risk. You should aim for a Sortino ratio at least equal to 1 to minimise risk.
Risk of drawdown: This is the probability of the strategy to reach the maximum drawdown.
5- Drawdown
A drawdown is a peak-to-trough decline during a specific period for the strategy wallet. A drawdown is usually quoted as the percentage between the peak and the subsequent trough.
The maximum drawdown (MDD) is the maximum observed loss from a peak to a trough of the strategy wallet, before a new peak is attained. If a strategy has $950 in it, and the funds raise to $1,000, drop to $900 before moving back above $1,000, then the strategy's wallet witnessed a 10% drawdown. Here we can see its value, the period on which it happened, and the recovery time. In some cases, there won't be a recovery.
The potential loss (equity drawdown) represents the drawdown experienced by the strategy from the starting capital. If a strategy has $1,000 and the funds rise to $1,100 and then fall back to $900 before rising above $1,200, the strategy's portfolio has suffered a potential loss of 10%.
The average drawdown takes into account all the drawdowns witnessed during the period of the backtest.
The drawdowns are a good way to evaluate the risk and also to know when one should stop a losing strategy.
6- Charts
Here comes the funky colored visual part. If you like to see the trends, you'll like this part of the deep analysis.
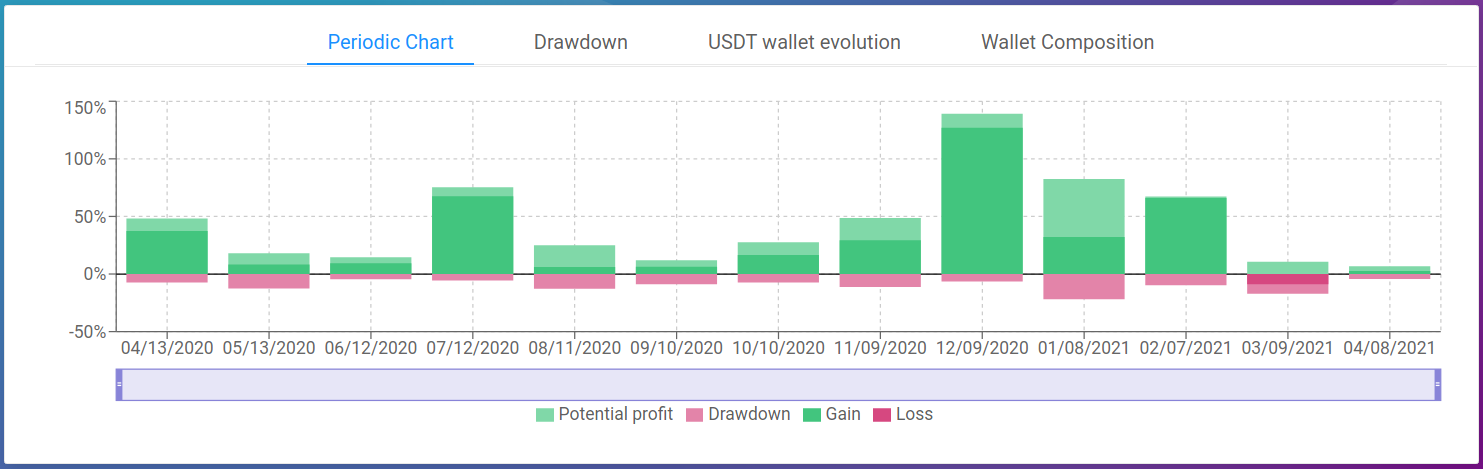
The periodic chart shows the profit and loss for each period. The dark color is simply the evolution between the open and the close of the period, the light colors represent potential profits and losses, i.e. the maximum and minimum values through which the strategy went through, similar to candle wicks.
This chart allows you to see which periods were profitable, and which ones would need an improvement.
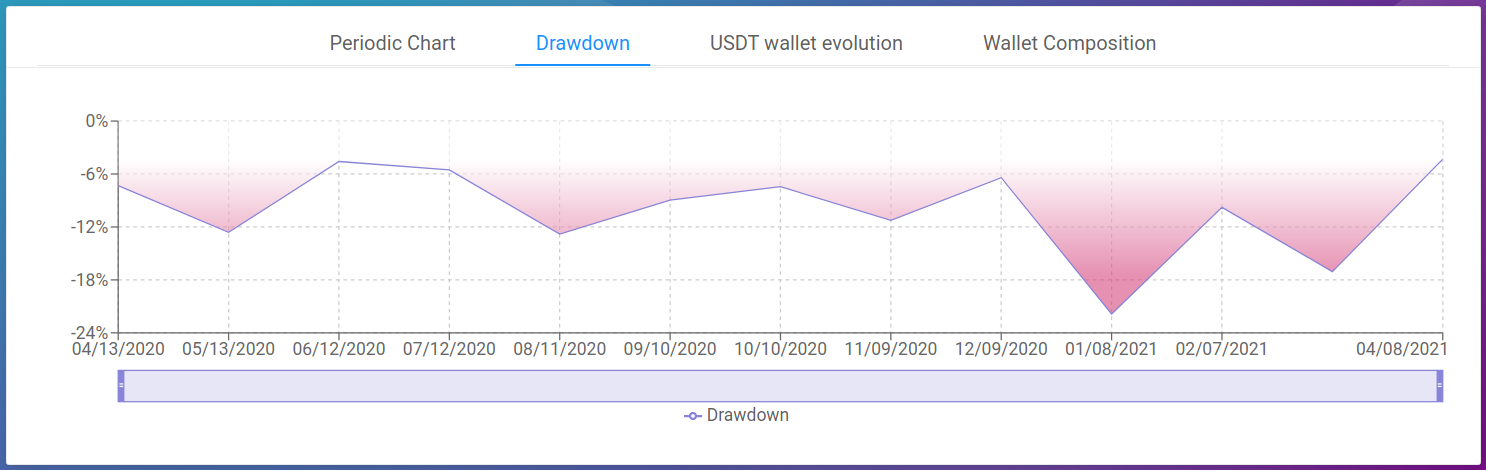
The drawdown chart shows the drawdown of each period. This works like the maximum drawdown but is specific to each period.
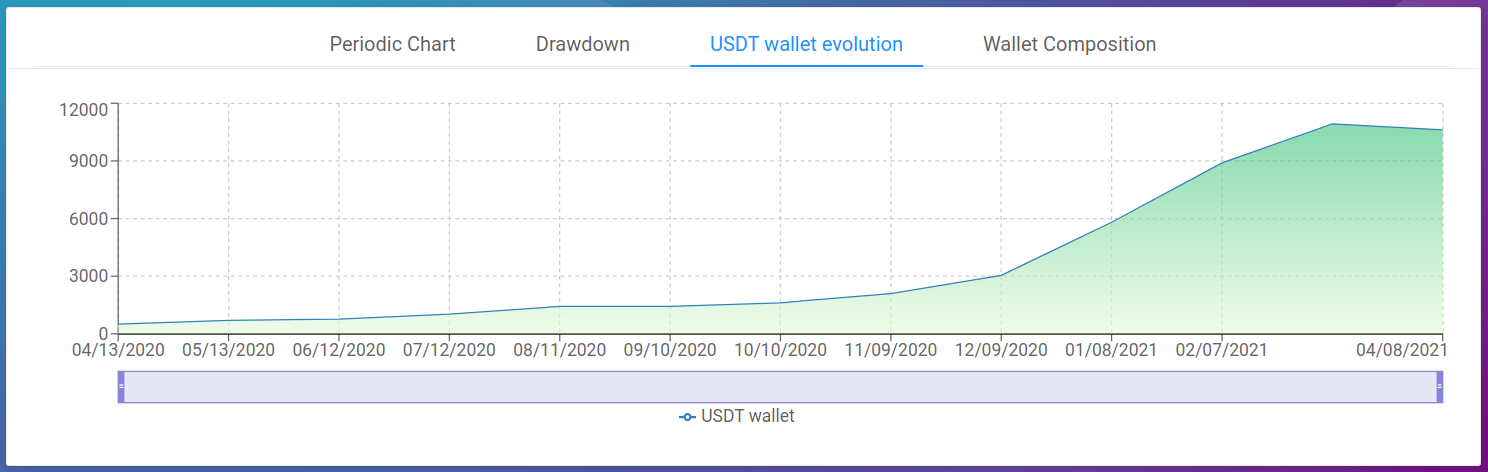
Here you can simply see the evolution of the total wallet value. It can be displayed from the base or the quote perspective.
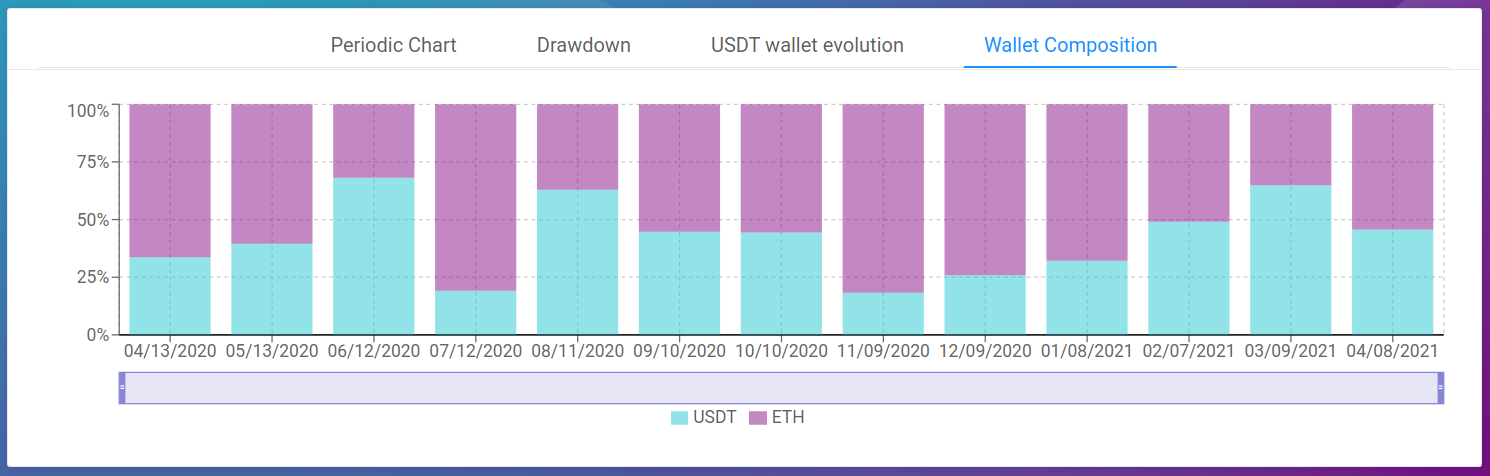
This chart shows the composition of the strategy's wallet. You can appreciate how the strategy invests and you can use this information to help evaluating the risk taken.
It is also a good indicator of the real impact of the strategy on your wallet.
Aiming for the moon?
Before exploring the possibilities of this tool further (perhaps in a future article), I suggest that you continue to experiment on your own and, for the more enthusiastic, watch a Kryll Academy on the subject, here (english subtitles availables).
Now it is up to you to learn how to master the Deep Analysis to be able to efficiently analyse any strategy, and for you, creators, to optimise your flows and better manage the behavior of your strategies.
But above all, don't forget: get hydrated and trade with Kryll.io!
Website : https://kryll.io
Twitter : @Kryll.io
Telegram EN : https://t.me/kryll_io
Telegram FR : https://t.me/kryll_fr
Discord : https://discord.gg/PDcHd8K
Facebook : https://www.facebook.com/kryll.io
Support : support@kryll.zendesk.com