Ichimoku Kinko Hyo (一目均衡表 Ichimoku Kinkō Hyō), usually shortened to “ichimoku”

Ichimoku is finally available as an indicator on Kryll.io. This means you can now use your knowledge of this awesome indicator inside the Kryll.io strategy editor.
About Ichimoku
Ichimoku is a complex yet famous collection of indicators that forms one big indicator to rule them all
Ichimoku can serve as a trend indicator as it is mostly directed towards the future (the cloud is always several periods in advance of the current price).
However it is so complete that you can use it in many different ways that we will let you the joy to discover.
We do not recommand using this indicator with zero knowledge of what Ichimoku really is, as it can be failry complicated and is not as “straight forward” as other indicators.
Here is a quick guide/cheatsheet to better understand this indicator
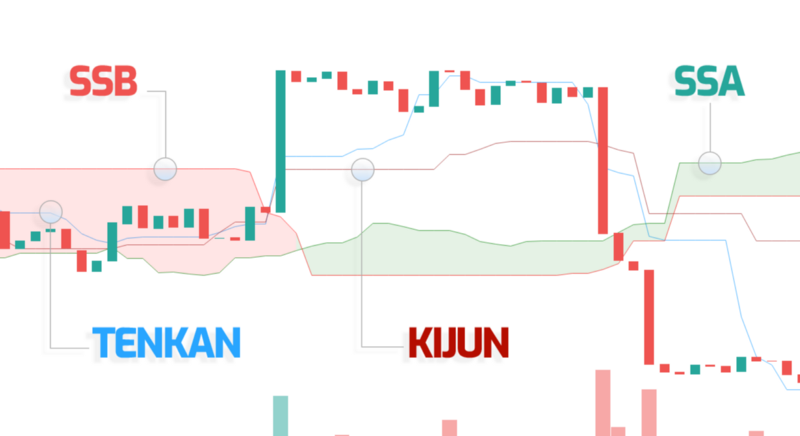
- SSA (Lead 1 on tradingview) and SSB(Lead 2 on tradingview) forms the Kumo Cloud one of the most important part of the Ichimoku Cloud indicator, SSA is the green line and SSB is the red line.
A great rule of thumb is that whenever the price is above the cloud and the cloud is green (SSA > SSB) there is a strong upward trend. If the price is below the cloud and the cloud is red (SSB > SSA) then, logically there is a strong downward trend. Nevertheless, remember that we are in the crypto world, so everything an indicator tells you does not necessarily means something.
- Kijun (Base line on tradingview) is the thin red line. With defaults settings it is calculated as so : (26-period high + 26-period low)/2
- Tenkan (Conversion Line on tradingview) is the thin blue line. With defaults settings it is calculated as so : (9-period high + 9-period low)/2
As you may have noticed, Kijun and Tenkan are kind of like moving averages. And so they can be analyzed as such. For exemple if the Tenkan crosses up the Kijun, it means there is a good chance an uptrend is happening (Think of the golden cross of two MAs).
- Chikou (lagging span on TradingView) is not used in Kryll.io due to its very low utility in a tradingbot.
You can learn more about Ichimoku on Investopedia.
Usage in Kryll.io
Now that you know a bit more about Ichimoku and know that you can accomplish something big, it would be good to know how to use it inside a trading bot in kryll.io.
Here’s a quick guide on how to use the brand new Ichimoku Block in Kryll.io strategy editor.
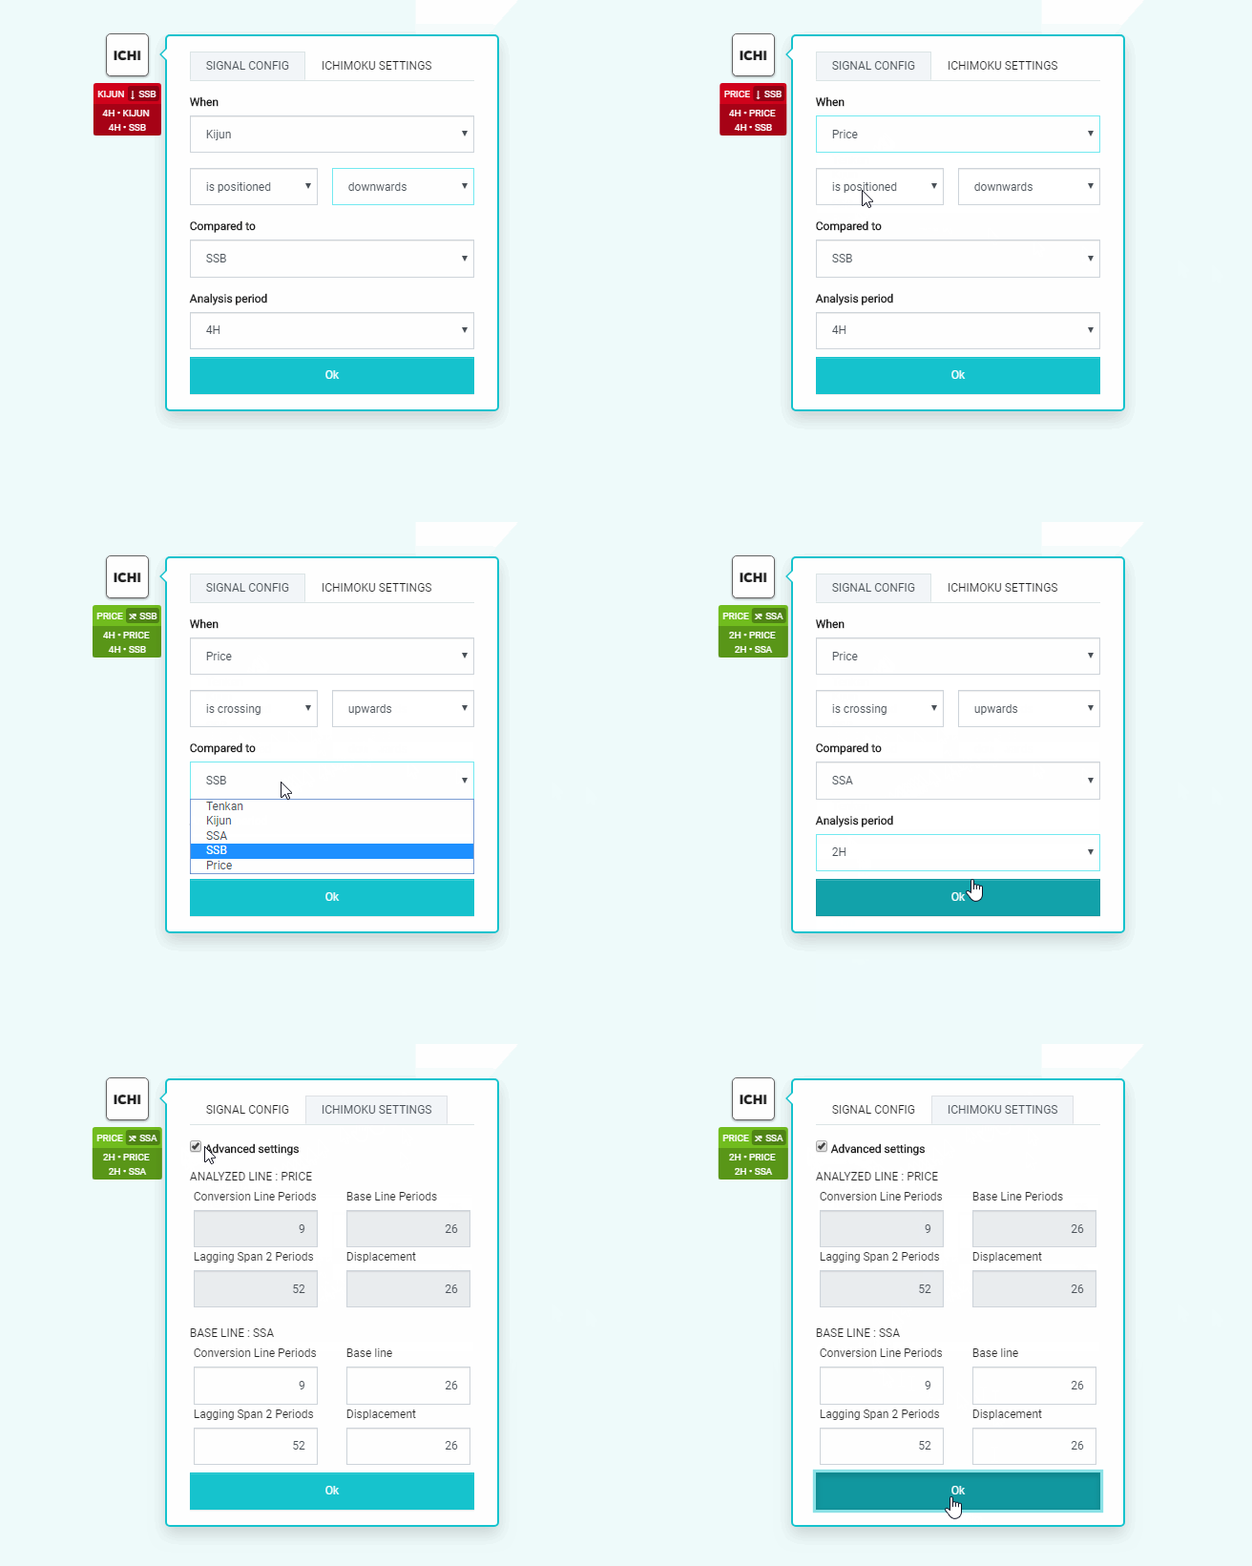
Signal Config
Analysis period: The period that Ichimoku will take into account (If you choose 4H, Ichimoku will use 4H candles).
Trigger type: Position or Crossover
Position: Triggered when the analyzed line is above or below the compared line
Crossover: Triggered when the analyzed line crosses the compared line(depends on the “compared to” section)
Analyzed line: This is the first line you have to choose on the settings. You can choose between : SSA, SSB, Kijun, Tenkan and Price.
Compared line: This is the line that the analyzed line will be compared to. You can choose between : SSA, SSB, Kijun, Tenkan and Price.
Ichimoku Settings
Conversion Line Periods: Periods on which the Tenkan (Conversion line) is based on.
Base Line Periods : Periods on which the Kijun (Base Line) is based on.
Lagging Span 2 periods : Period on which the Lagging Span 2 is based on.
Displacement: Linked to the Ichimoku indicators displacement.
Note that the settings on Ichimoku are extremely important, it does not only changes the period of an MA. You can’t expect it to “work” correctly if you are putting random numbers. Yet, we strongly encourage you to try out new settings, or search on the internet for new ones. Don’t hesitate to share them on our Kryll.io Telegram channels too.
Use Case of Ichimoku inside Kryll.io
Now that you know the basics of Ichimoku AND that you know how to use it inside Kryll.io, we’re gonna present you a situation where it can be useful to think about Ichimoku while building your automated trading strategy on Kryll.io.
As we said earlier, you can use Ichimoku as a trend identifier, take for example this case scenario :

We can see that the price grows as long as it is above the cloud, and the Tenkan is above the Kijun. So with that knowledge we can create a very simple strategy to trade “safely”.

This strategy takes the very basic concept of “Buying when it drops, selling when it grows”. But with a twist, Ichimoku is here to help us identify good times to buy. So here’s an explanation of how this strategy is built.
First, we are verifying if the price is Above the cloud, (that’s the two blocks “Price ↑ SSA” and “Price ↑ SSB”), and that the Tenkan is above the Kijun (that’s the Tenkan ↑ Kijun block), plus we wait for 1% drop in the market.
This ensure that we are only buying in an upward trend.
Then we are buying.
Then either the price goes up by 6%, we sell
OR if the price drops by 4% we sell our belongigs, after all, we still need a stop loss, crypto trading is not that easy.
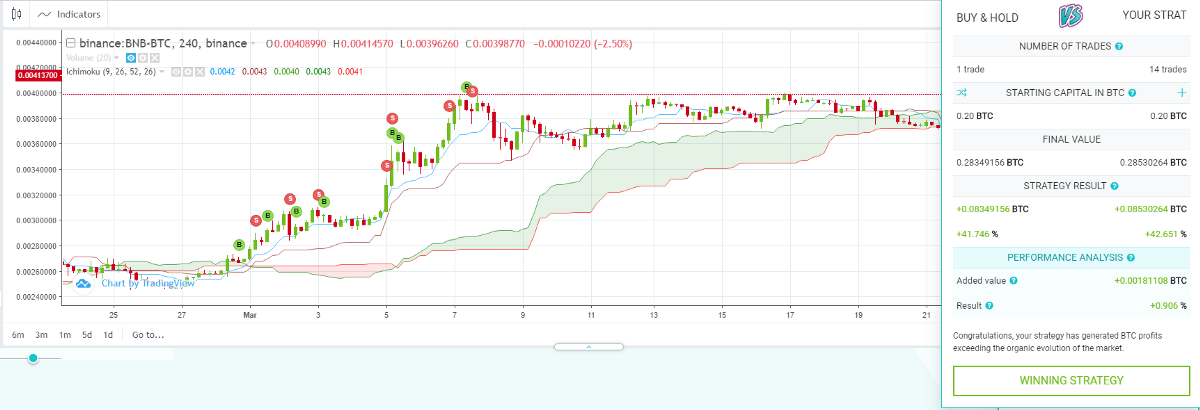
And voilà ! It outperforms buy and hold, and it is not even optimized, it’s on a 10 days period, and it is a “safe” strategy, much safer than “Holding and waiting for the top” at least. And you are winning 42% of your initial investment while sunbathing. How awesome !
Note that we used 4H period to create this strategy.
There you go ! It’s your turn now !
Thank you for reading this guide. We hope you enjoyed it and learned a bit more about how to use the famous ichimoku indicator inside an automated strategy ! Now go and create your own on Kryll.io ! We can’t wait to see what you will do with it !
Don’t hesitate to try everything with this new block, backtest is here for that matter. If you have any more questions, feel free to ask them in our telegram chats where the community or the devs will try to help you the best they can !
Log in now to get your referral link: https://platform.kryll.io
Happy Trading!
Be sure to follow us on all our social networks.
Our website: https://kryll.io
Twitter : @Kryll.io
Telegram : https://t.me/kryll_io
Discord: https://discord.gg/PDcHd8K
Facebook : https://www.facebook.com/kryll.io
Support : support@kryll.zendesk.com
