

MACD Block - This block is a "conditional block" that is triggered based on the behavior of the MACD (Moving Average Convergence Divergence) momentum. This indicator is used in technical analysis to predict the trend of a price and to identify buy or sell signals.
Reminder of the basics
The MACD represents the difference between moving averages and prices. It is calculated as the difference between a long term exponential moving average and a short term exponential moving average, commonly 26 and 12 periods.
The first curve, which is a simple oscillator of exponential moving averages, is called the MACD line. The second curve graphs a second curve called the signal line representing an exponential moving average of period 9 of the first curve. The succession of crossings and thus convergences-divergences of the moving averages between them gave the name of this oscillator: "moving average convergence divergence".
This indicator is used to technically anticipate market trends and provides buy signals when the fast MACD curve crosses the slow signal line (the crosses identify changes in the balance of power between bulls and bears) and conversely, the downward crossing of the slow signal line by the fast MACD curve represents a sell signal.
If you are unsure about what the MACD is you can learn more about this indicator by checking out Investopedia tutorials as well as the Tradingview wiki.
Block configuration
In the block parameters you can select the timeframe for the indicator (Time Unit), its length (the number of candles studied) and the signal configuration you'd like to use in your strategy before proceeding.
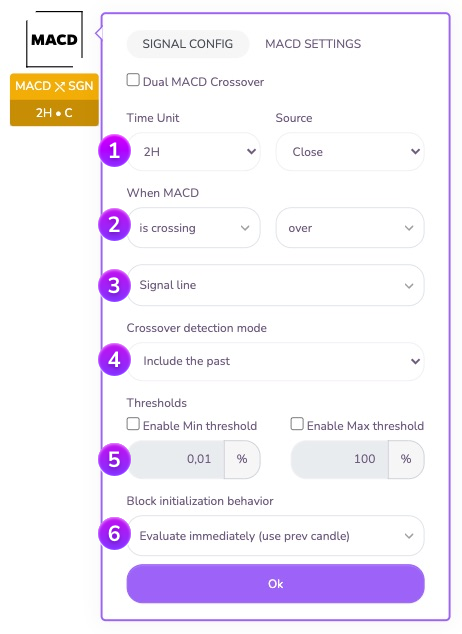

Time Unit: You can specify the timeframe you want the indicator block to operate on, as well as the price source that will be used to calculate the MACD value on the candles.
- Source: Specify here the source of the candle data among the different options.
- Closing: Instantaneous value when the candle is closed.
- Opening: Instantaneous value when the candle opens.
- Highest: Highest value of a candle.
- Lowest: Lowest value of a candle.
- hl2: Average between highest and lowest value of a candle.
- hlc3: Average between highest, lowest and closing.
- ohlc4: Average between opening, highest, lowest and closing.

This area allows you to select the MACD condition that will trigger the block. This is where you specify which signal you want to exploit:
- Position triggering: the block is triggered when the MACD line is in the expected area (above or below) in relation to a reference value (signal curve or zero line).
- Crossing trigger: the block is triggered when the MACD line crosses from one area to another in a specific direction (upward or downward crossing) in relation to a reference value (signal curve or zero line).

Here you specify the reference value that will be used to validate or not the triggering condition of the block. You can choose between :
- the horizontal Zero line, generally used as a reference point for trading signals between upward and downward trends.
- The Signal line, generally used as a reference point for trading signals between current upward or downward trends

In crossover waiting mode, an additional option is available: the taking into account of the past. This option allows you to take into account (or not) the previous candles for the validation of the block during its initialization.
Example: Suppose you set up a block to detect a cross between the MACD and the ZERO line at 1 o'clock, and the strategy arrives on this block at 5:30. Suppose further that the MACD line crosses the ZERO line at the close of the candle (at 6:00)
- the block configured for 'Include the past' will be triggered because it detects a crossing between the 5 o'clock and the 6 o'clock candle.
- the block configured for 'Ignore past' will not be triggered because it will wait for a cross only from the 6 o'clock candle and will ignore the past state of the indicator.

In the case of the analysis between two curves, Kryll provides by default a set of threshold tools to erase false signals. These tools are available for the MACD block.
Minimum threshold: This threshold allows you to define the minimum percentage above which the block will validate the crossing or the position. It is thus possible to erase the "false signals" that can appear during a range period, when the curves frequently intersect on very small variations.
Maximum threshold: This threshold allows you to define the maximum percentage beyond which the block will not validate the crossing or the position. It is thus possible to avoid validating a condition on movements of extreme amplitudes or too late.

Behavior at initialization: Here you can define the behavior of the block at its initialization. You can either wait for the current candle to close (option "Wait for next close"), or instantly evaluate the block conditions on the last closed candle (option "Evaluate immediately"). This last option is particularly useful to perform analysis on several time units in parallel or to analyze an indicator on a macro timeframe (12H / Daily / Weekly...) without blocking the strategy by waiting for a candle to close.
Additional Configuration
It is sometimes useful to analyze the behavior of two MACDs together to extract signals or trends. The "MACD Crossing" option allows you to set up this type of analysis.
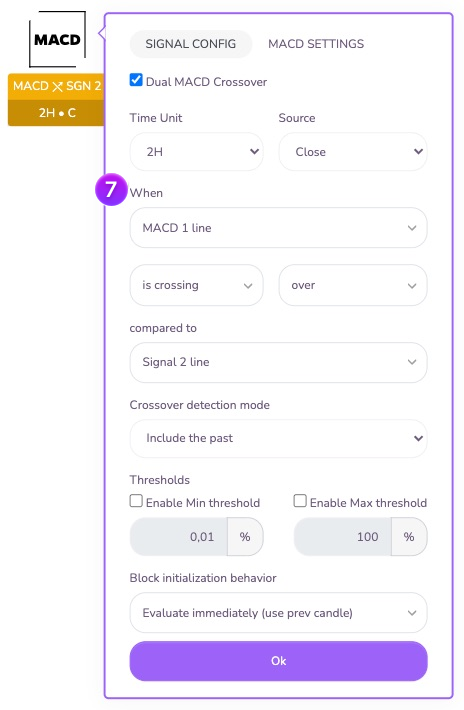

With two differently configured MACD indicators, it is possible to trigger the block when the line of MACD 1 is above or below MACD 2, or for example when the line of MACD 1 crosses the signal line of MACD 2.
MACD indicator(s) configuration
If you want to change the default values of the indicator, you can do so here:
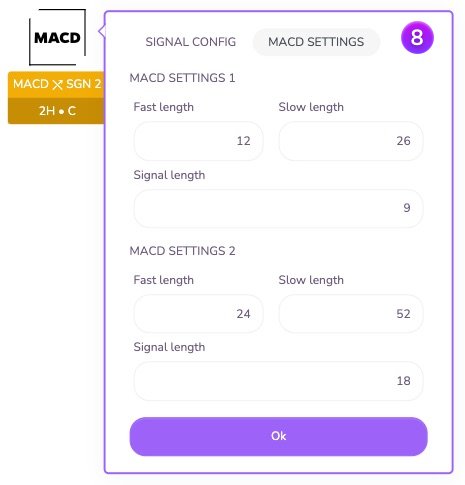

- Fast length: is the length of the first EMA that forms the basis for the calculation of the MACD indicator. Default value: 12
- Slow length: is the length of the second EMA that forms the basis for the calculation of the MACD indicator. Default value: 26
As their names indicate, it is customary for Fast Length < Slow Length
Signal length: this is the length of the second EMA of the MACD line (otherwise known as the signal line). Default value: 9
Join us on our Telegram and Discord groups as well as our other social networks to share your opinion and your feedback on the Kryll.io platform.

Happy Trading,
Website : https://kryll.io
Twitter : @Kryll.io
Telegram EN : https://t.me/kryll_io
Telegram FR: https://t.me/kryll_fr
Telegram ES: https://t.me/kryll_es
Discord : https://discord.gg/PDcHd8K
Facebook : https://www.facebook.com/kryll.io
Support : support@kryll.io