
How to choose the right time to launch a strategy?
We have seen in a previous article https://blog.kryll.io/risk-management-and-automated-trading/) the importance of diversifying on the pairs proposed by the strategy creator. In this article we will try to identify the best assets to optimize our results on kryll strategies.
Different issues:
It has surely already happened to you to move your positions on minor altcoins other than BTC, BNB, ETH and to lose more capital than if you had stayed on a few strong altcoins or crypto market (BNB, ETH, BTC). You traded in manual or bot trading ETH/USDT, you accumulate USDT but lost more ETH than you started with. You go all-in on BTC but you miss the recent BNB pump.
Different solution ideas:
- Select pairs based on their upward momentum (at least 3 months of uptrend without breaks and/or market leader with the option to partner with GAFAM … ranking from market cap). We aim here for the long term on “strong” values (refine according to the market trend).
- Check the RSI position of the chosen altcoin on the USD(T) or even BTC market.
- Reinforcement of trading positions if the market becomes unbalanced
The idea of this optimization is done in several steps
1. Search for leader/outsider assets ------------------------------------------------------
2. Detection of the RSI position of the selected asset ----------------------------------
3. Strengthening of trading positions-----------------------------------------------------
4. if the market becomes unbalanced ----------------------------------------------------
1. Search for leaders/outsiders assets (and outsiders)
Besides, the leaders “showcase of crypto-asset” that can accumulate over the long term as BTC, ETH, BNB, LTC and outsiders (at ETH) faster and cheaper in transaction costs as AVAX, DOT, SOL, MATIC, we also have new leaders in each important sector that we will see with, if possible, an upward momentum* of at least 3 months to optimize the money management, which then becomes dynamic thanks to kryll strategies, while mitigating volatility and/or the drop in performance if we had chosen a non-leader asset that had underperformed.
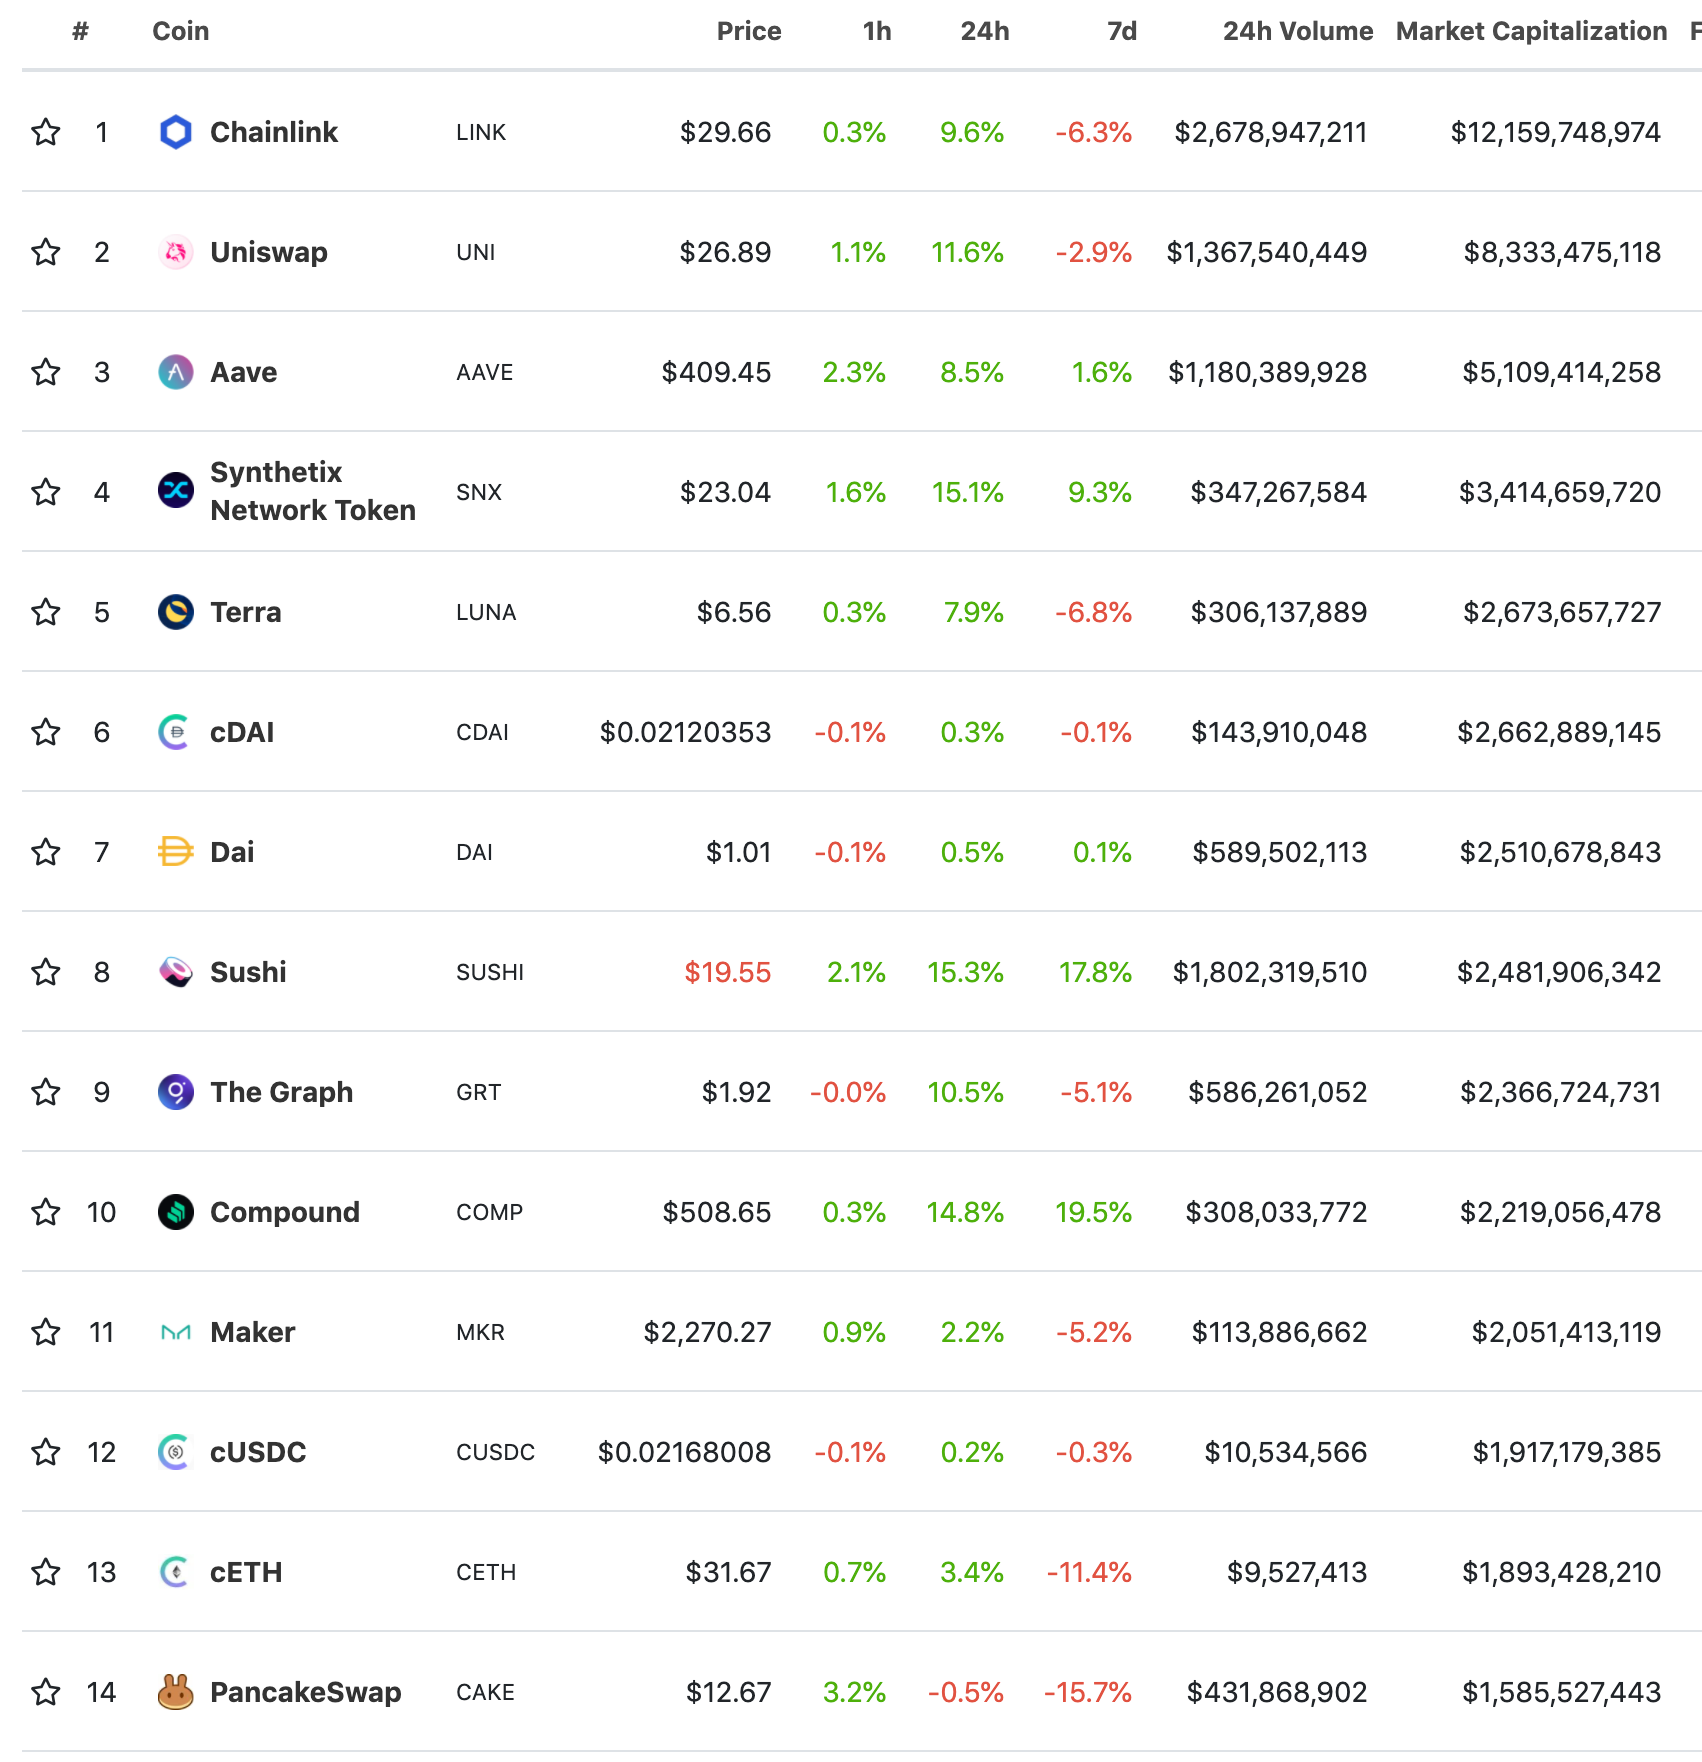
For the examples below, we will take the assets of the DeFi (decentralized finance) which are very fashionable and performing (the upward momentum of 3 months is respected) and it is the decentralized finance (DeFi) which is the engine of crypto at the moment (we will talk about it in an article soon).
We find for example (see DeFi table below) AAVE, UNI, LINK, SNX, LUNA, SUSHI, GRT and CAKE in the first 14 coins of the DeFi (which are boosting the crypto market at the moment and are still recent values), they can still increase knowing that SUSHI and CAKE are fighting against the leader UNI like XVS Vs AAVE.
Also, we can select some leading coin supporting NFT [non-fungible token]: This is another very promising sector that we will review in another article.
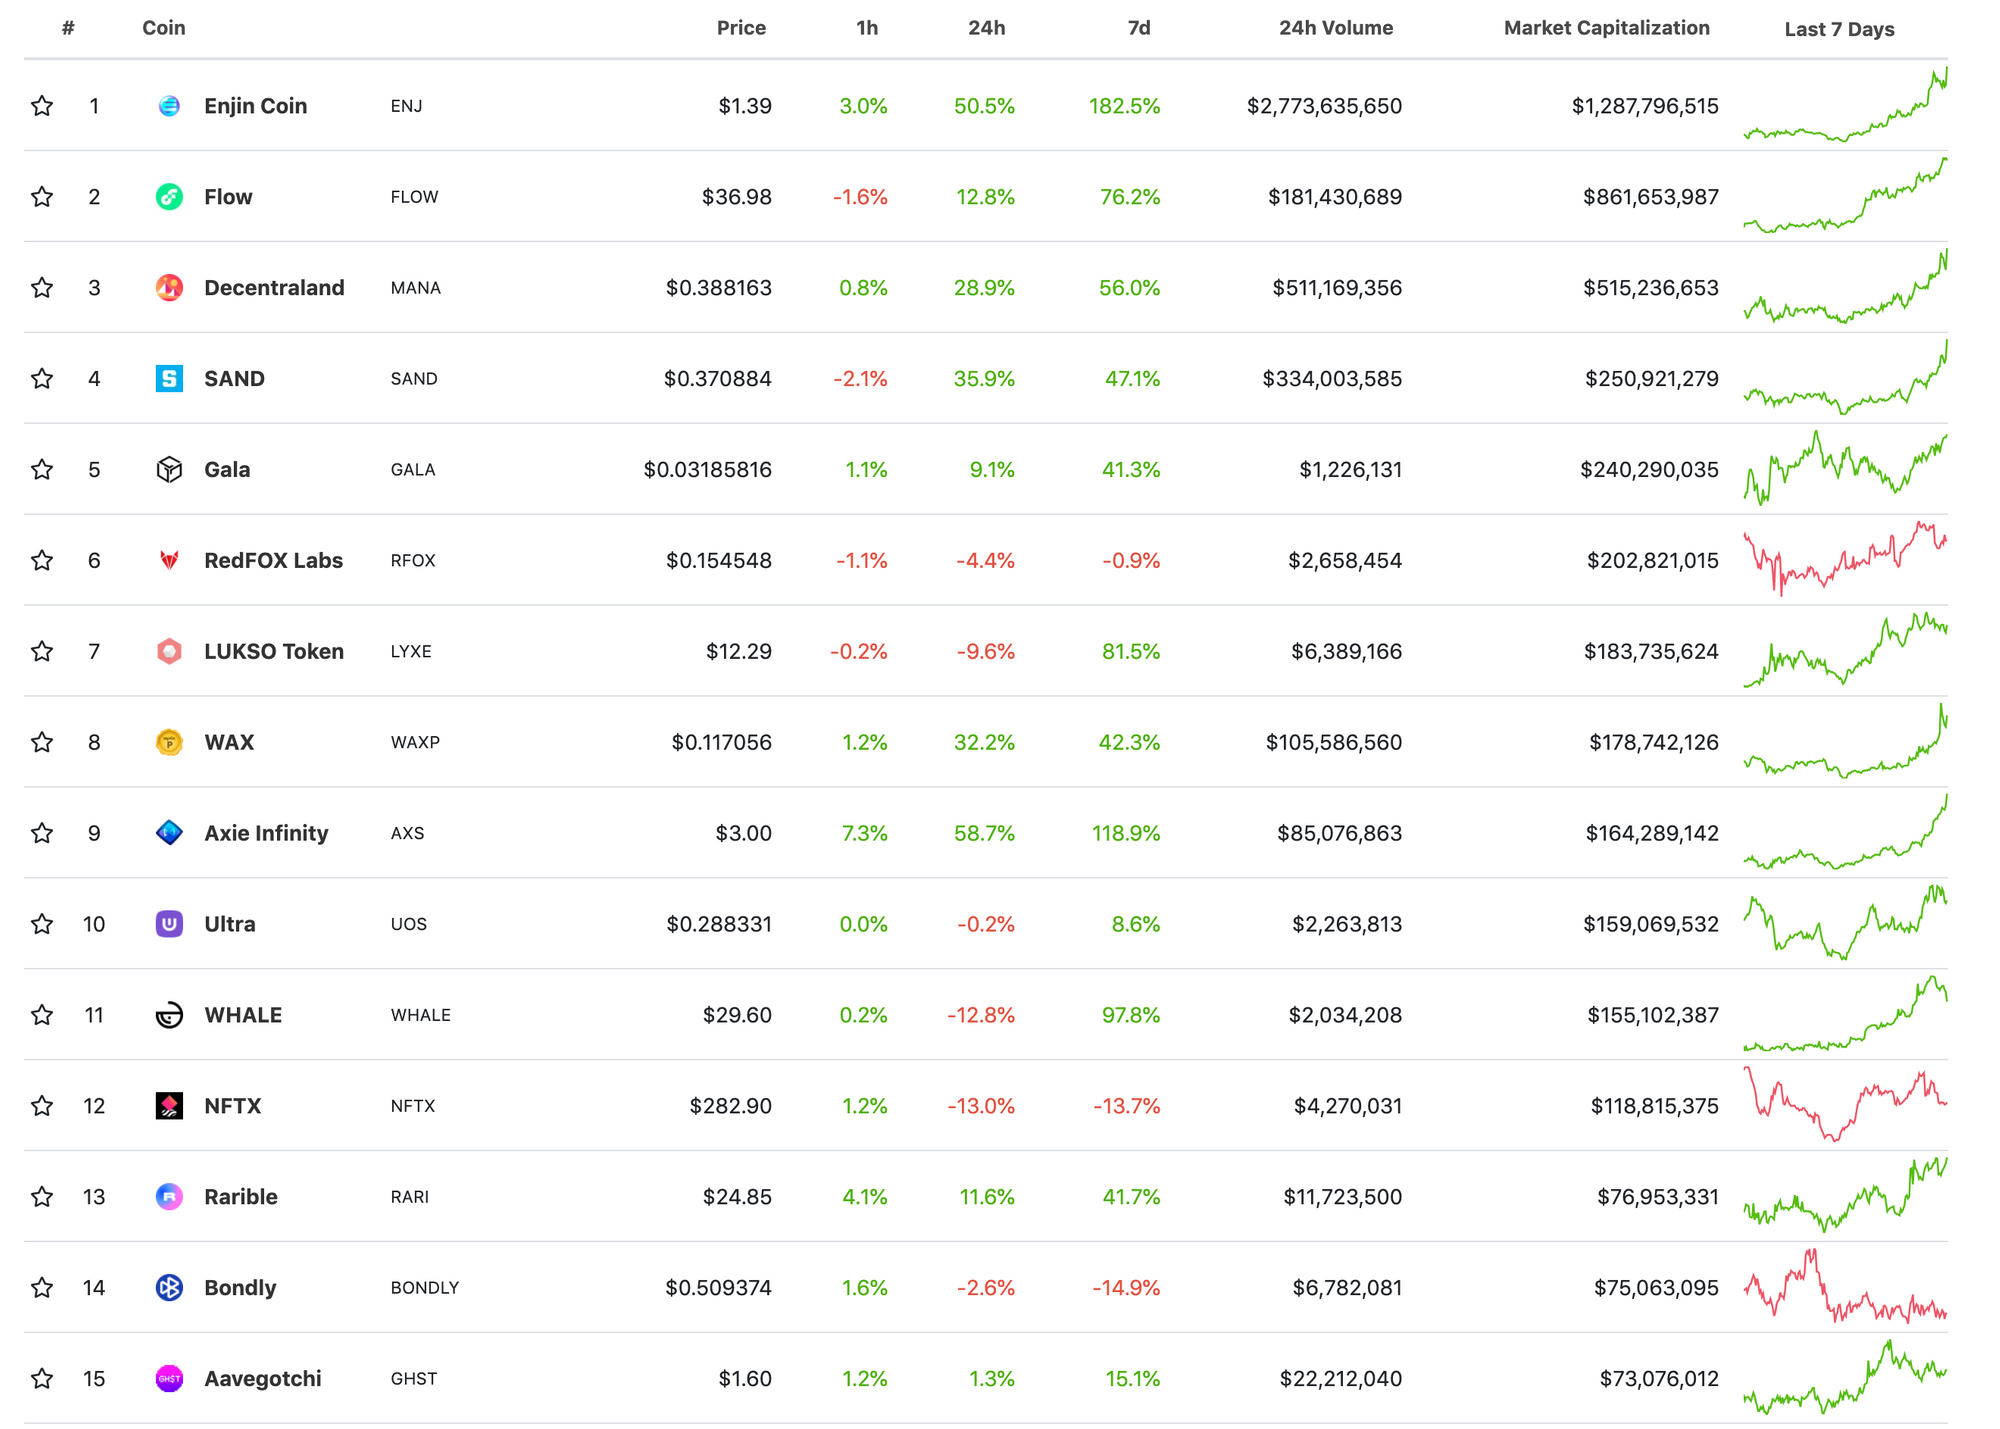
Analyzing the table above, we have the leader ENJIN recently accepted and regulated by Japan which offers a suitable environment for NFT and outsiders like AXS, FLOW, WAX, RARI and the last GHST on the Polygon blockchain of Matic.
2. Detection of the RSI position of the selected asset
After having chosen our leader and/or outsider, in my example we choose the outsider AVAX which isn’t in an awkward RSI position daily [see the analysis below] for an efficient start on an adapted strategy.
=> Ideally, the start of the strategy will be done in our example when the leading asset is in a growth phase from its RSI overselling zone.
RSI: The relative strength index—Relative strength index deriving from the price that gives the trend and strength of the market.
We will therefore target a rising RSI84 in the 30 and 50 h4 RSI84 zone, with 84 periods to attenuate market noise and have a more global vision. In other words, for RSI 84 on a 4H chart: the RSI corresponds to the average of the last 336 hours (84*4 = 336).
N.B: In our study, for simplicity, we won’t consider the RSI discrepancy [we will discuss this in another article]. We will have a clear and powerful RSI signal all the more if we use the RSI with long periods “84” and a higher tf in weekly, daily, 4h that we can cross-check with other indicators.
We use in our example a flexible bot type “TESEO” that buys and sells in anticipation during up/down phases. The dump will be cashed by the automatic buy trades up to a threshold determined by publisher; this is the accumulation phase and during the rise phase, we will have automatic sales per step in the underlying base currency type BNB, ETH, BTC, USDT… Being in Bull market, we will have difficulties to find strong coins under the 50 RSI84 zone in tf daily, so we will choose the tf 4h and 1h (see graph below).
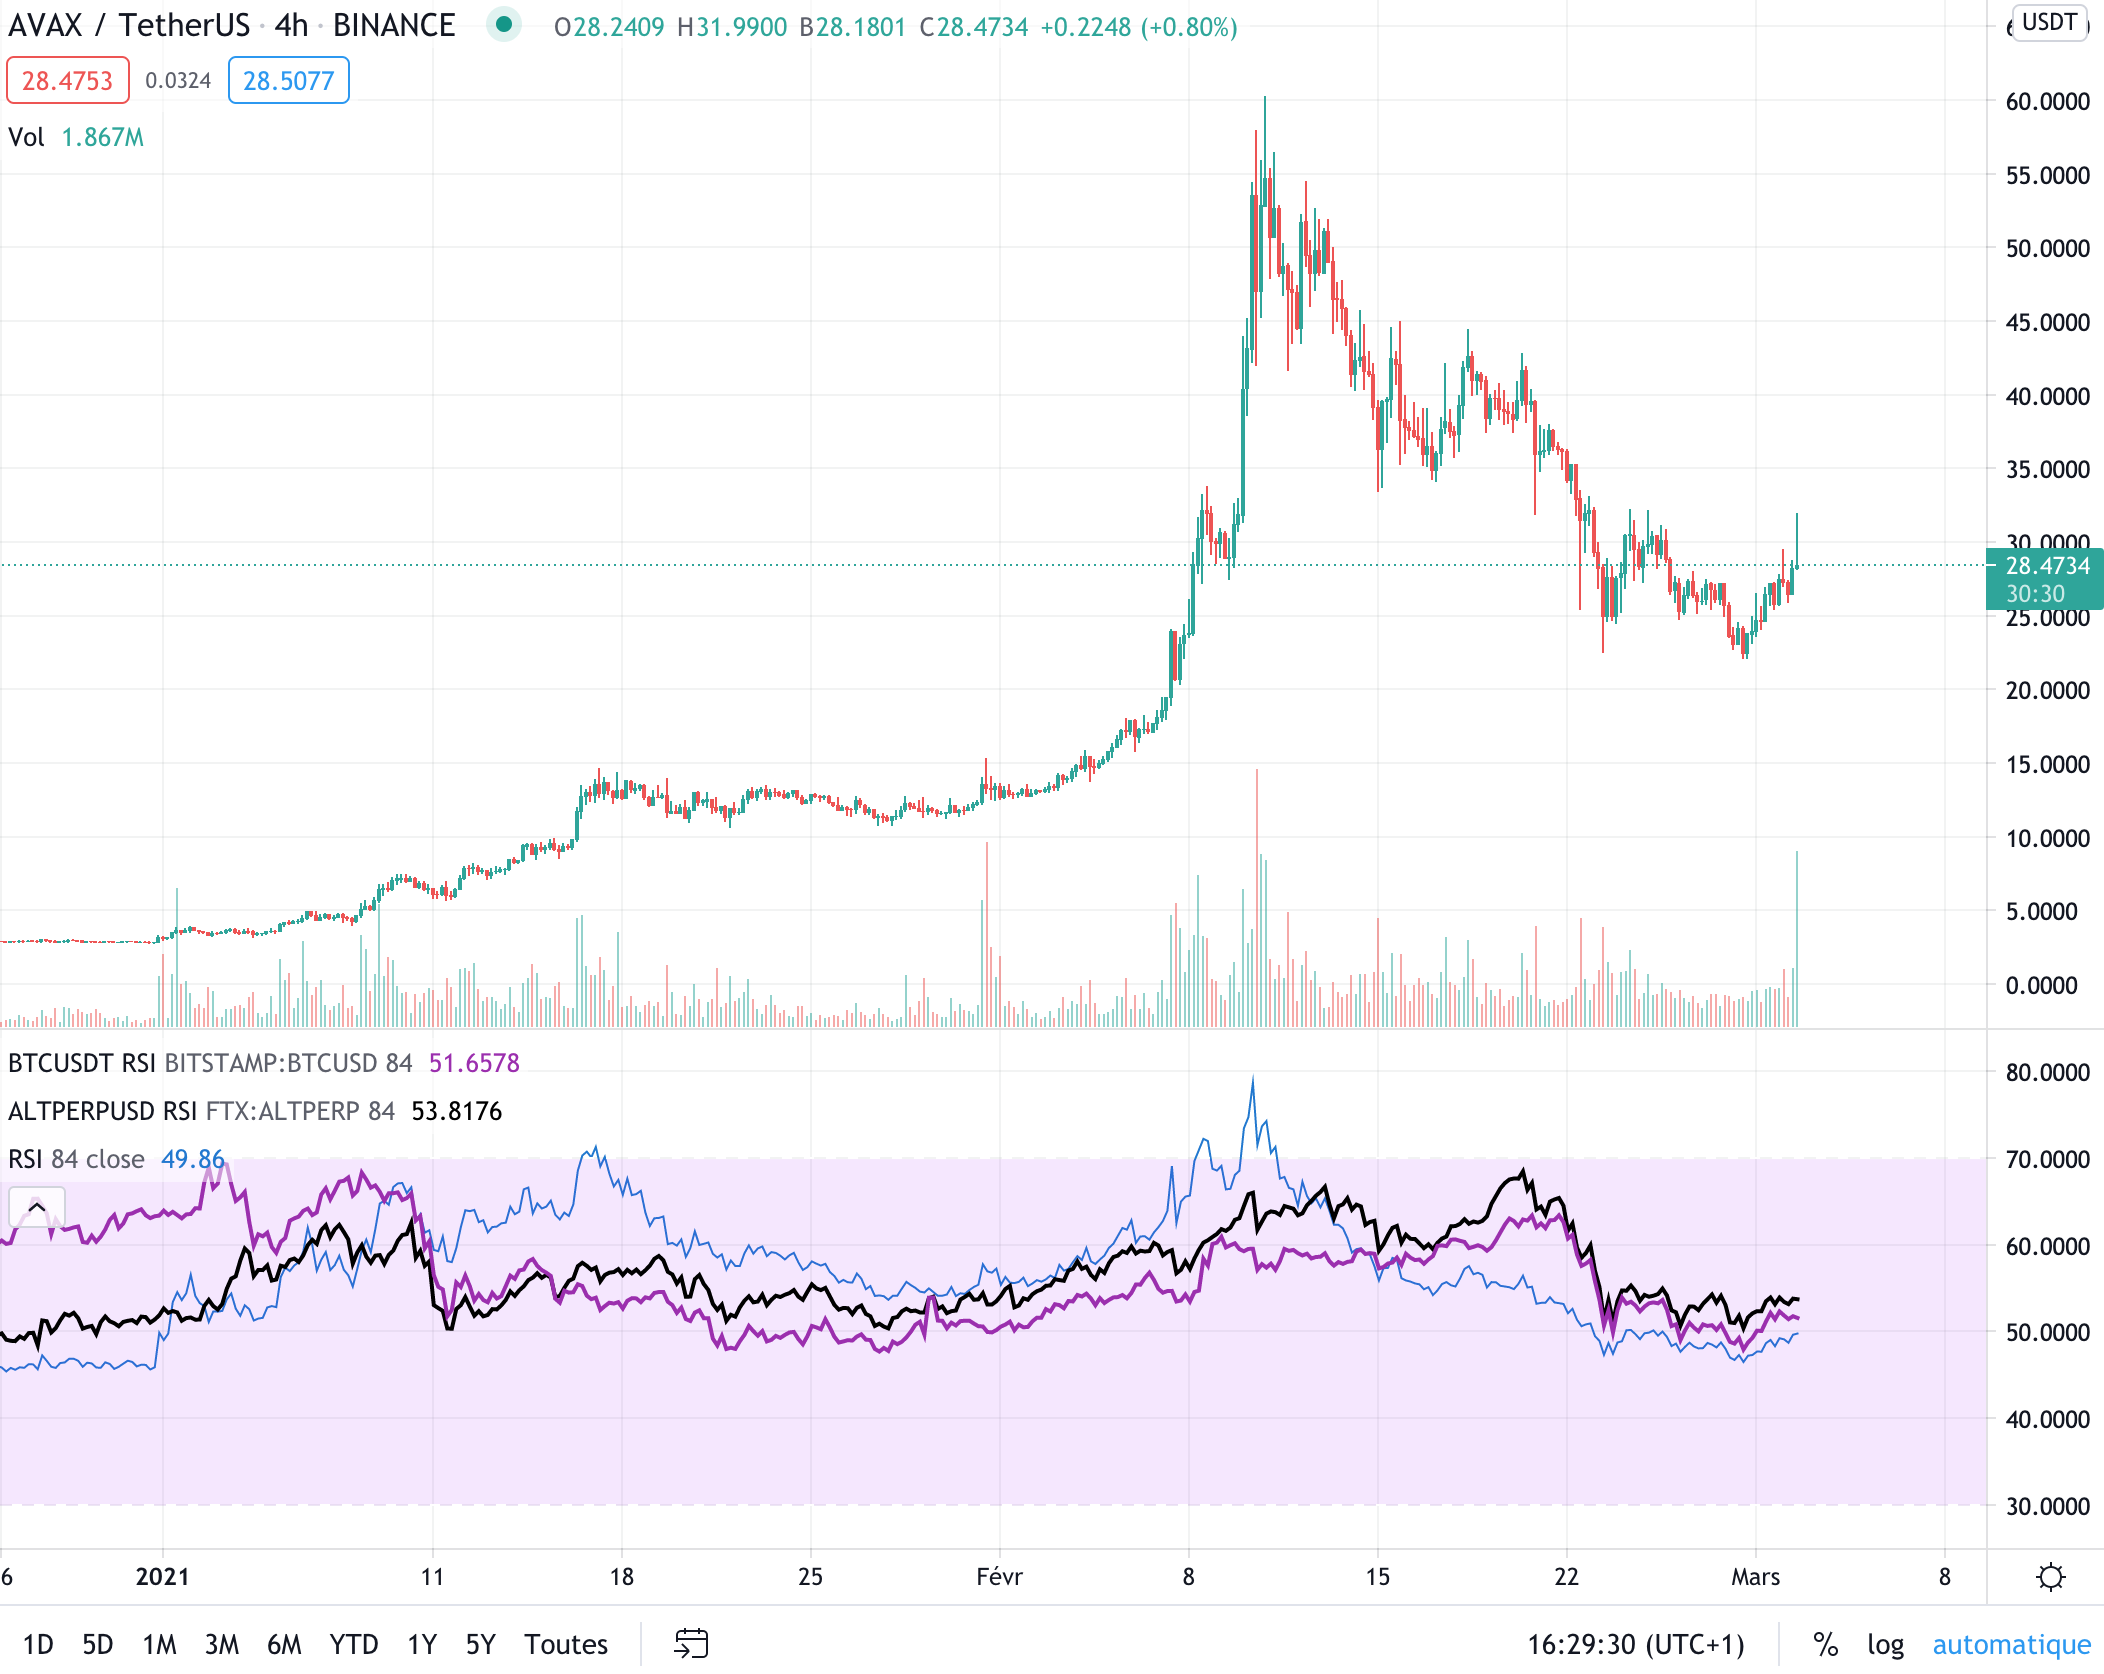
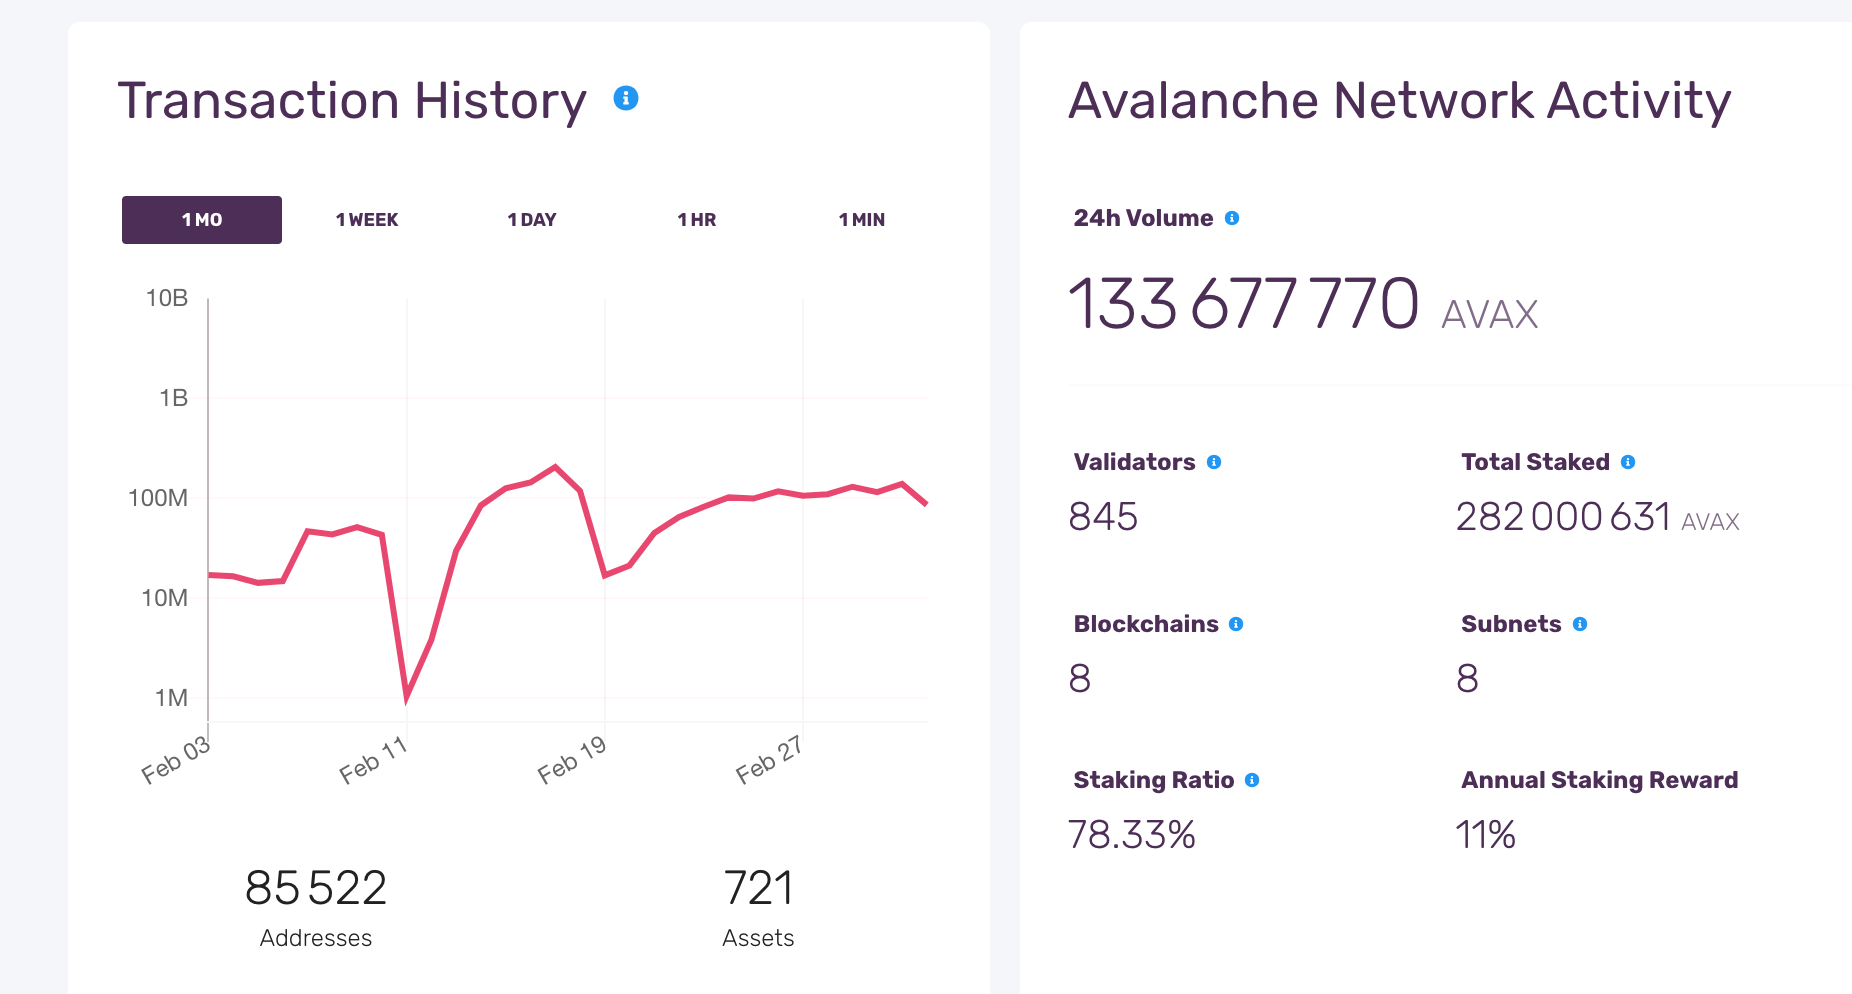
We note that the rsi84 of AVAX/USDT (blue curve) is stagnating like the btc and the ALTPERP index. But AVAX, have a better upside potential since it is below and in the neutral zone of the rsi84: 50, so there is no buy signal (neutral RSI zone) but potential for a rise that can be crossed with an “on-chain” indicators (on the blockchain) such as the number of daily trades that continues to increase gradually since February 3 with a recent stabilization on the 100M (see graph below).
We can therefore conclude that for the moment there is no buy signal, but the most important thing: there is no invalidating signal (such as a hyper overbought rsi) and we can start adapted strategies in spot market.
Thus, we can use a solid and adapted strategy [see marketplace and in-depth analysis after backtest] now with for example a medium-term strategy that will wait for a strong buy signal or in our study take a short-term rebound strategy with more probabilities than avax pump in the very short term given its neutral position but especially that we are in a bullrun period.
We will backtest(see below) a strategy that fits AVAX/USDT. The TESEO is available in the MarketPlace at the following link.
Reminder: Backtesting and installation of the strategies are free on Kryll, you only pay when you launch a strategy in Live Trading.
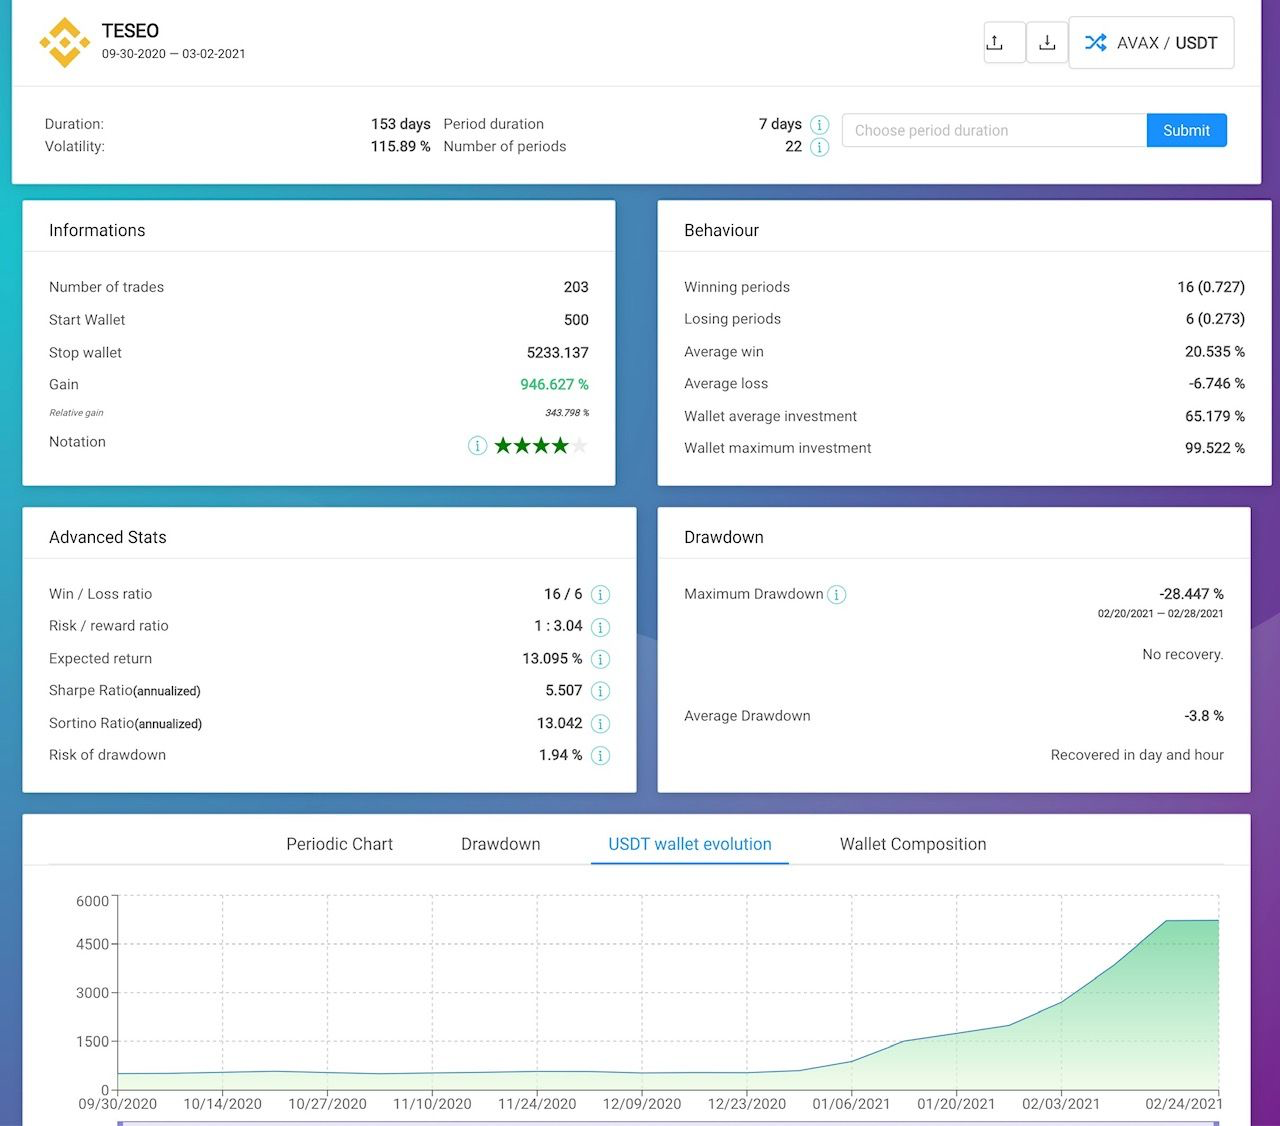
Thus, with kryll bot trading, we can accumulate usdt with strong outsider coin [in our study, it’s AVAX] that have a higher probability of return on investment, combined with solid strategies and other positions on the leaders/outsiders assets.
3. Strengthening of trading position
Strengthening of position with the “ideal” start of a new strategy based on the purchase signal of a leader already present in a strategy that continues live or new positioning on a new leader/outsider based on a purchase signal from its funds (salary, annuities, cash flow from real estate or yield farming in DeFi … etc)
We can launch parallel strategies on other crypto oversell <50 [RSI84:30 is ideal] or in neutral zone trying to enter before the rsi84 daily 60–70 zone with hyper overbuying followed by a reversal of trend.
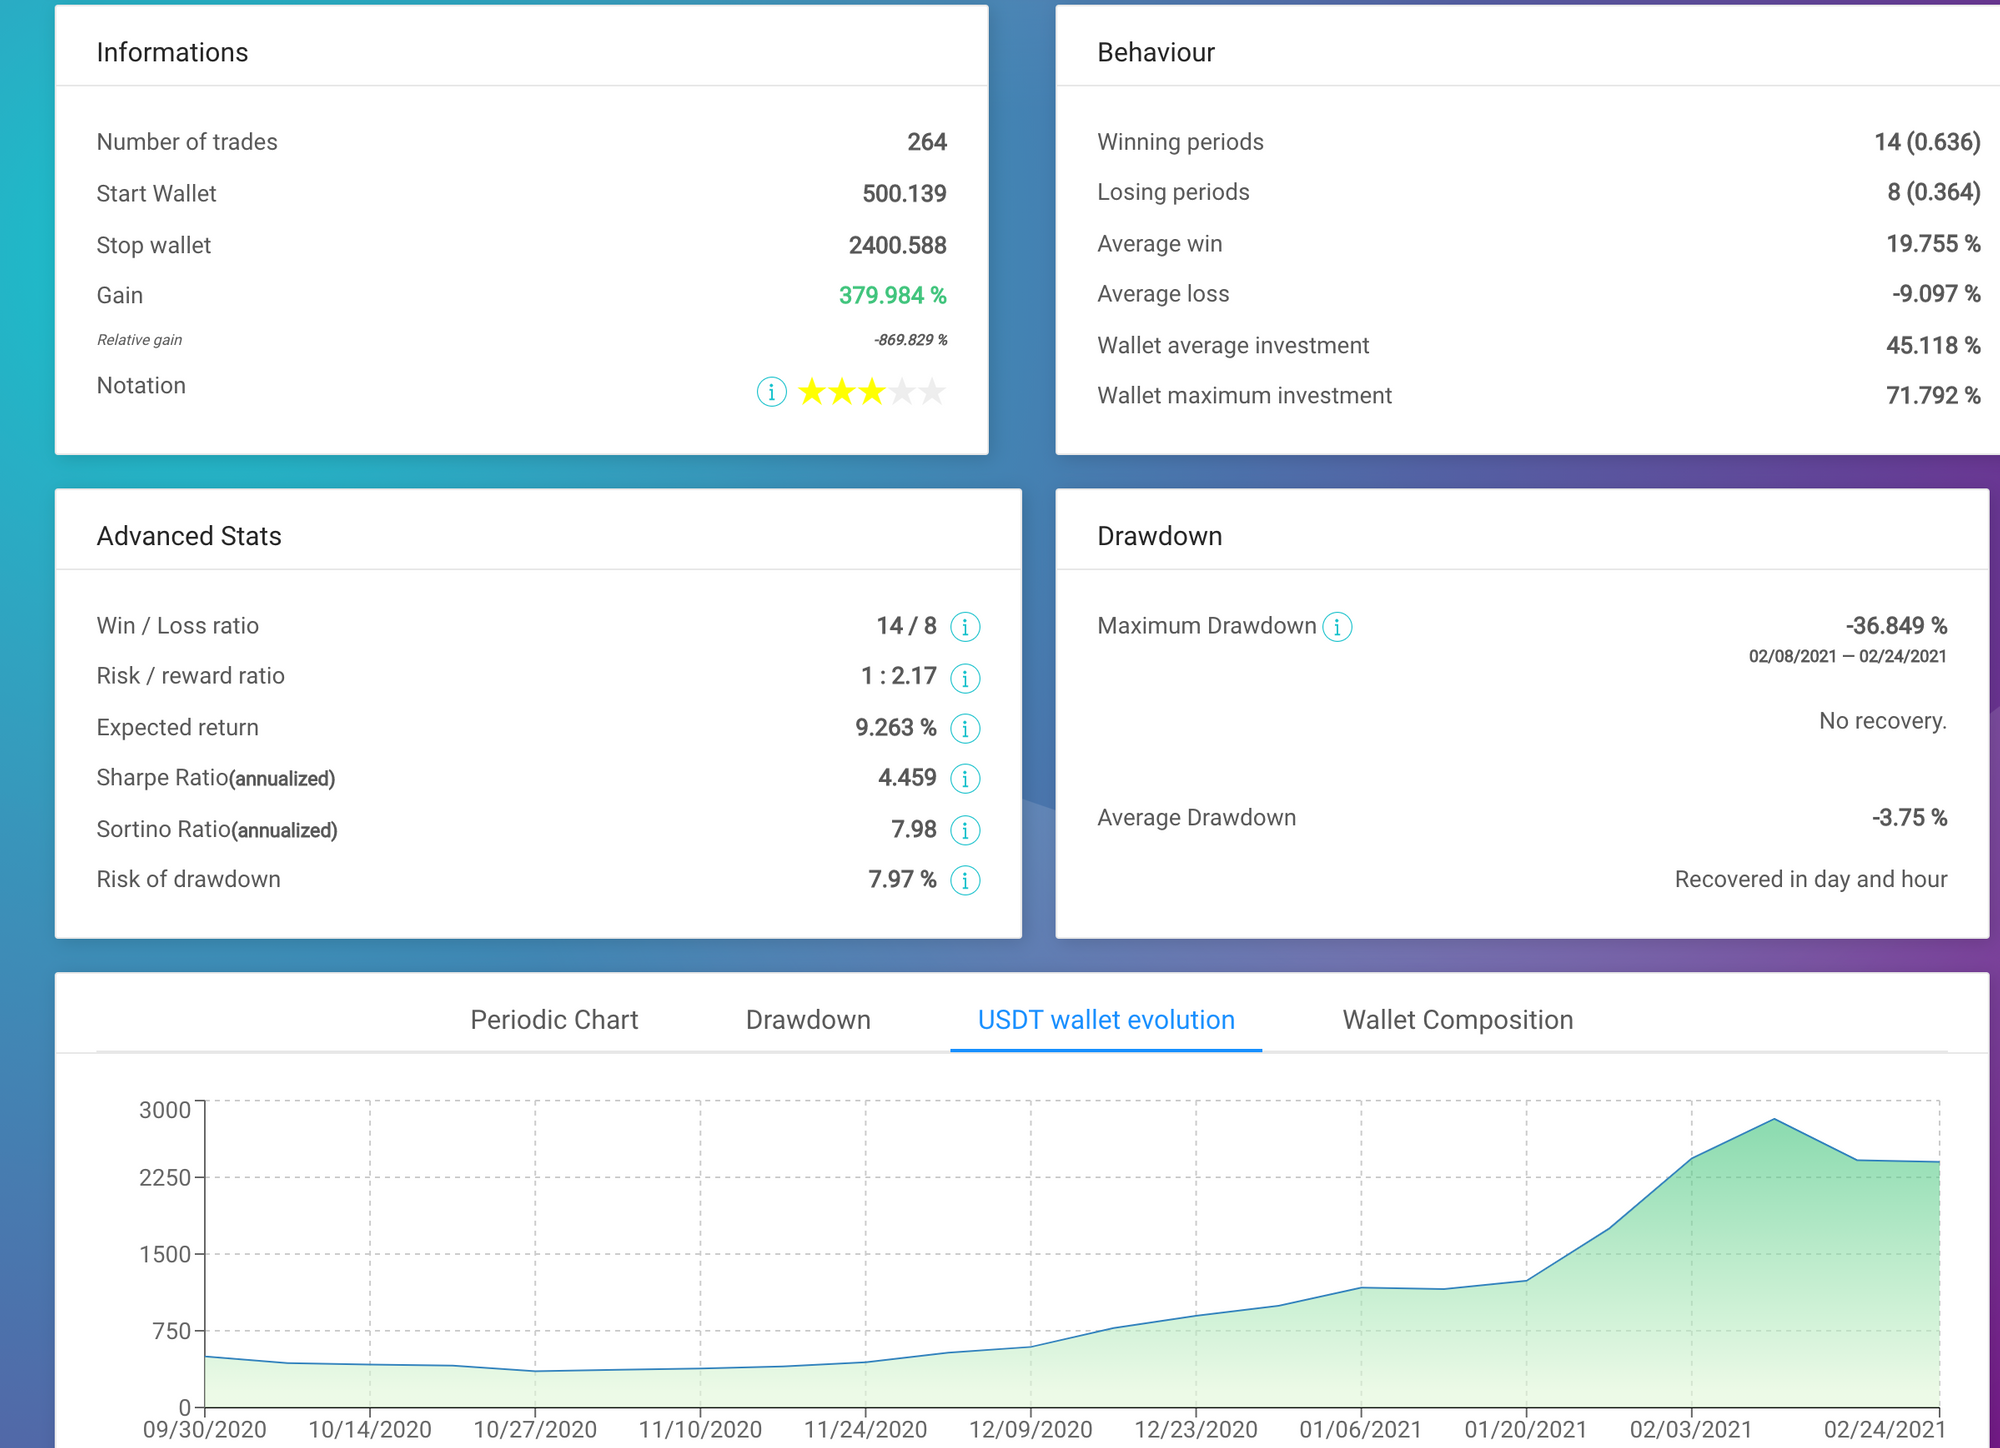
In the following figure, we have backtested(see below) the VALORANT strategy available in the MarketPlace for leader EGOLD: EGLD/USDT which is in the neutral zone rsi84 rising in tf 4h.
4. if the market becomes unbalanced
In this example, the global market imbalance by a major asset (example: Buy signal on BNB) we can reinforce and start a new strategy on this asset and leading coin associated with the BSC [Binance Smart Chain, BNB being the gas for the transactions] such as CAKE which is important in providing liquidity on the pancakeswap protocol.
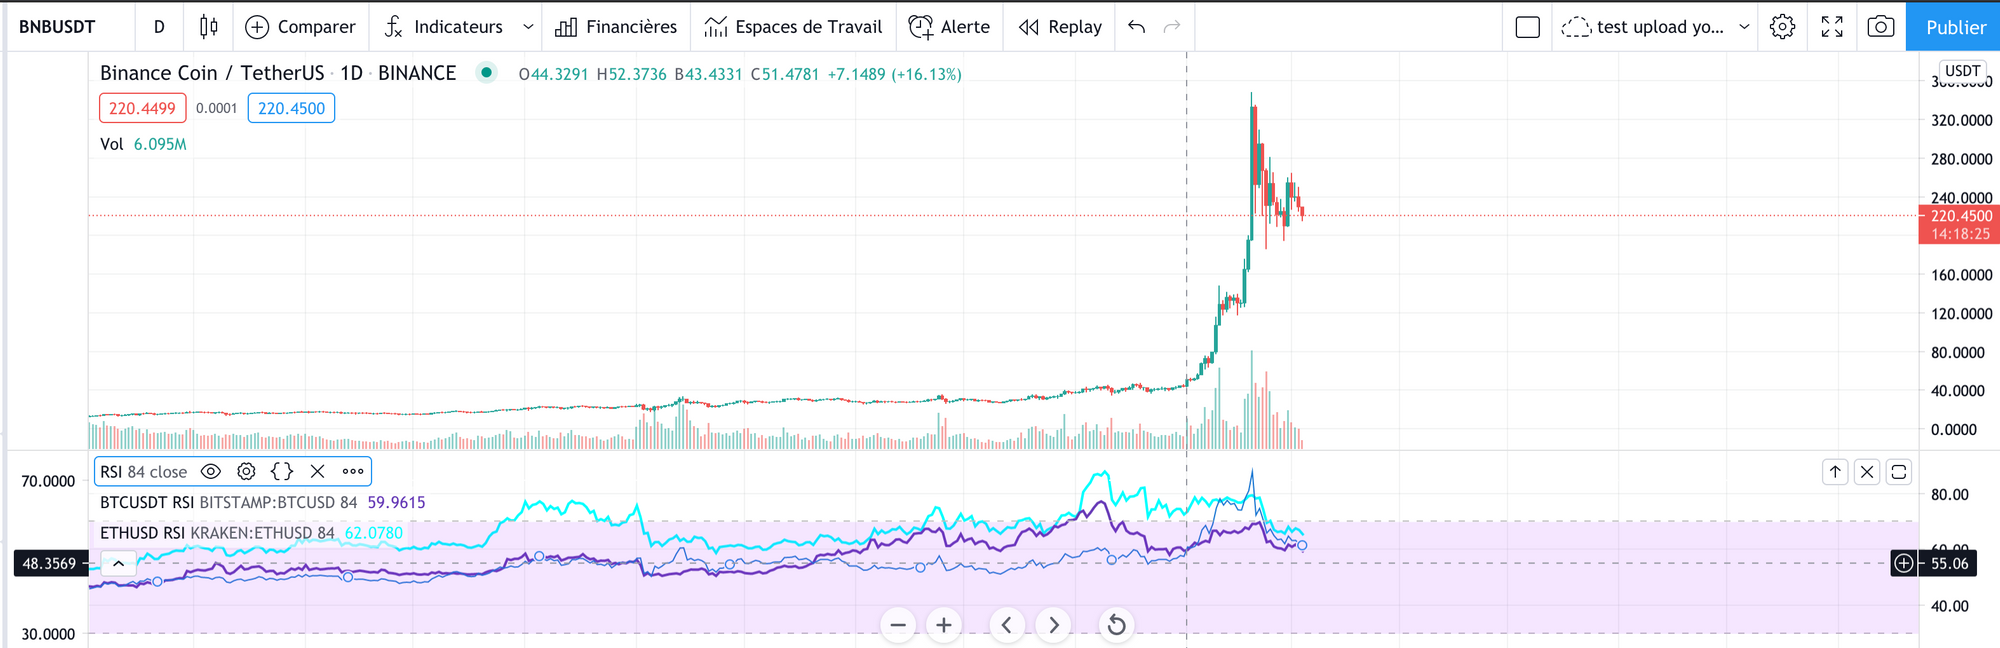
Thus, when the market is unbalanced with a strong bullish signal: here, 02/02/21, the RSI84 daily of the BNB (navy blue curve) rises very strongly from its neutral zone 50–55 daily. it’s the typical example of a buy signal on BNB, a leading and alternative coin to ETH; we can therefore inject USDT (or the dominant market coin at this time) by starting a new adapted strategy (here on February 2nd) on BNB/USDT with equity or by cutting (then restarting) part of the gains collected with the other strategies. The asset associated on BNB blockchain is CAKE (new leader: see the DeFi table] so we can also launch an adapted strategy in parallel (see backtest and in-depth analysis).
Conclusion:
We have seen that diversification of assets is important to launch strategies but with our study we can target these leaders/outsider assets to have a higher probability of gains with efficient and adapted strategies. Don’t hesitate to follow the market caps and prices evolution (3 months momentum) by sectors to determine for you the leader/outsider assets. The CoinGecko tool can help you because it filters the categories:
Go further:
Some tools to compare the rsi84 of a targeted asset against another one ex: KRL/USD (calculated by trading view) with rsi84, the search bar of “function category” on trading view; select “relative strength index” and add 84 periods.
Then, after importing script via tutorial below, you can move the graph rsi84 BTC/USD to the main graph RSI84 KRL/USD to compare and analyze signals.
Exemple of “boardtest” to compare the rsi of the target asset (here KRL) to the rsi altperp (20 largest altcoins on FTX) and btc:
https://fr.tradingview.com/chart/KRLUSD/TPiHrO8C/
Mini tutorial to import rsi84 script
Copy/past in pin editor trading view and rename « your alt » rsi84…
//@version=3
study(title="BTC/USD RSI", shorttitle="BTCUSDT RSI")
chart = input("BITSTAMP:BTCUSD", title="Source")
len = input(84, minval=1, title="Length")
src = security(chart, period, close)
up = rma(max(change(src), 0), len)
down = rma(-min(change(src), 0), len)
rsi = down == 0 ? 100 : up == 0 ? 0 : 100 - (100 / (1 + up / down))
plot(rsi, color=aqua, transp=0, linewidth=2)
band1 = hline(70, color=white)
band0 = hline(30, color=white)
To write another RSI84 pin code, you can search the symbol of charts for another coin in trading view…
If you want to add another coin, search symbol on trading view, ex: FTX:ALTPERP or BINANCE:BNBUSDT
And then you change its two lines:
study(title="BNB/USDT RSI", shorttitle="BNBUSDT RSI")
chart = input("BITSTAMP:BTCUSD", title="Source")
BIBLIOGRAPHIE
FRAZER, B. Les anomalies du marché d’actions.
L’émergence d’une stratégie d’investissement pour investisseurs individuels par le prisme de la finance comportementale et de l’analyse technique. 2017.
https://dumas.ccsd.cnrs.fr/dumas-01449182
LES PHASES DE TENDANCE — Étude de John Boik,
Momentum haussier p26. Les travaux de John Boik ont mis en avant les avancées majeures de l’indice Dow Jones Industrial Average 30 [DJIA 30], de 1890 à 2005.
It defines the major upward trends of the period according to the following characteristics:
-Price increases for at least 3 months;
-40% minimum price increased;
-Corrections that don’t exceed 15% during these bullish phases.
Happy Trading,
Website: kryll.io
Twitter: @Kryll.io
Telegram EN: https://t.me/kryll_io
Telegram FR: https://t.me/kryll_fr
Discord: https://discord.gg/PDcHd8K
Facebook: https://www.facebook.com/kryll.io
Support: support@kryll.io
