
With Bitcoin coming down from its all-time high of $69,000 and making lower highs the sentiment is quite bearish overall with the fear index currently sitting at 12 (extreme fear territory). While generally, there is a bounce to be seen during moments of high sell-off due to fear similar to this one, the Wyckoff distribution schematic playing out would mean a substantial and progressive selloff is yet to be seen.
With respect to the rest of the traditional markets. Should the stock market recover or depending on the US Fed monetary policy going ahead, it may save the crypto markets from further bloodshed given the relative correlation we’ve seen over the last 2 years. Fundamentals aside, it appears that the technicals spell trouble with Bitcoin showing trendline breaks and bearish patterns.
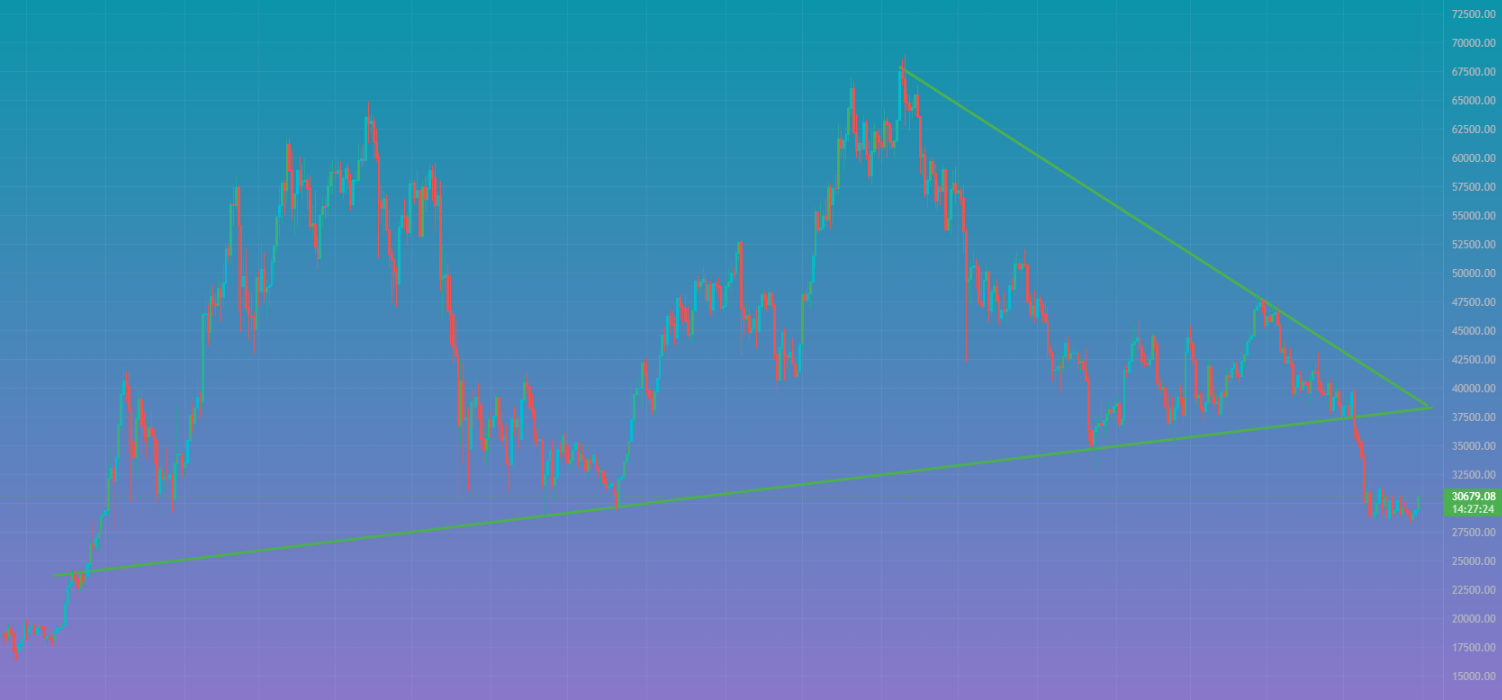
Although, this could be one huge fake-out and an opportunity for experienced whales who see this as a buying opportunity. So let’s go through what we are seeing here:
We have a trendline break on BTC:
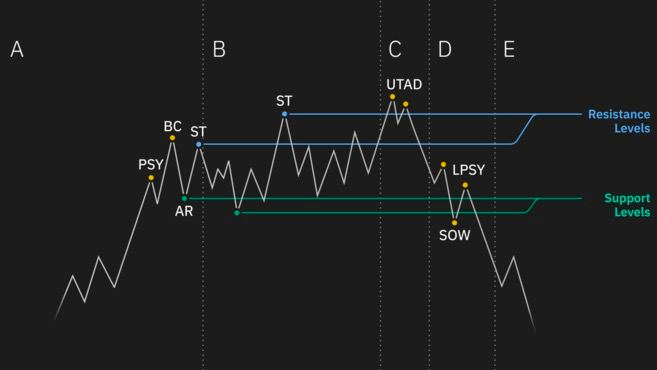
Here’s what a Wyckoff Distribution looks like:
And THIS is what Bitcoin looks like on a daily chart:
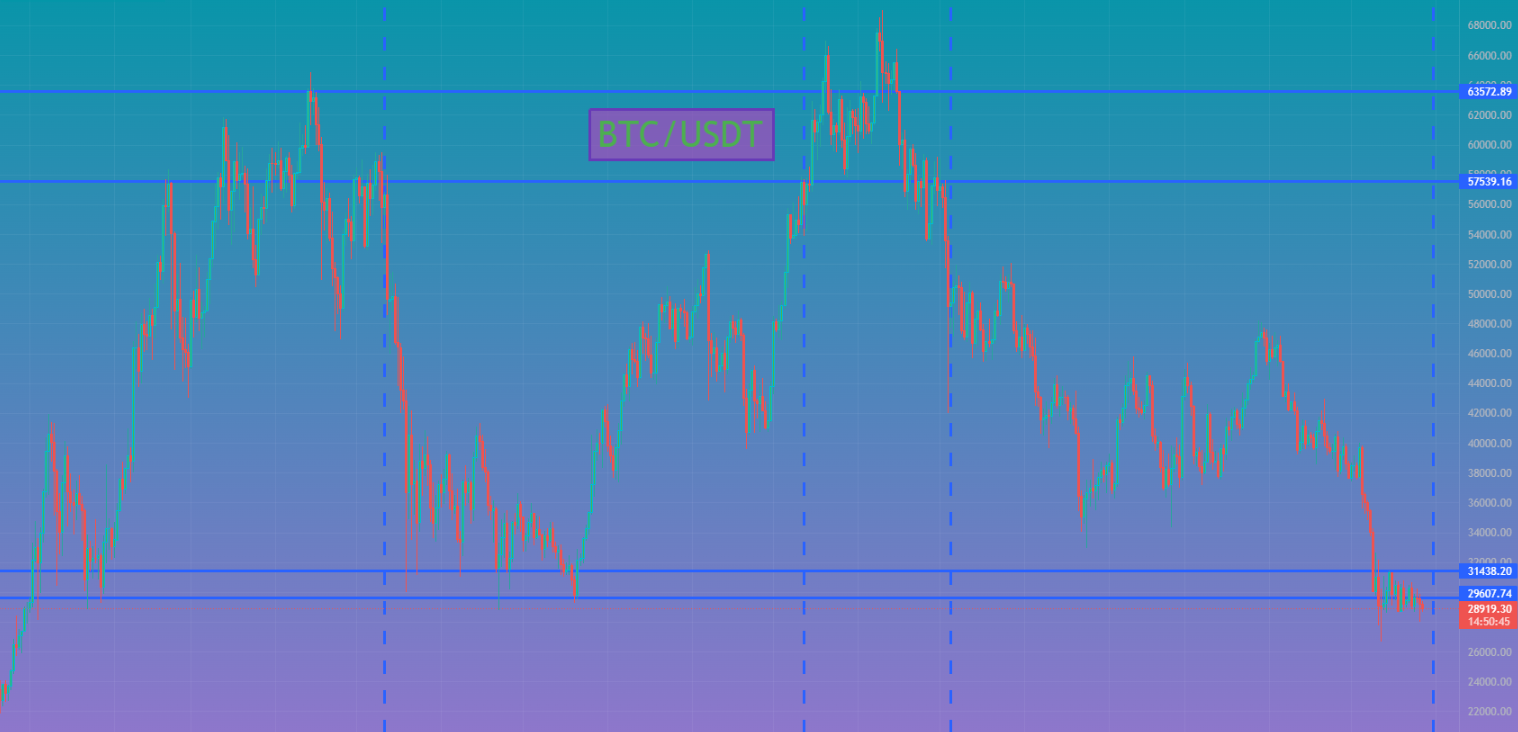
Looking at this, you can see the similarities between the model and the current chart.
But is it all a straightforward call for concern? Throughout the years we’ve witnessed the market bounce during most times of extreme fear and it usually happens when everyone is certain that things are only going to get worse. Scrolling through Twitter, you may notice that the usual crypto influencers are even somewhat bearish right now. And this is happening after Bitcoin has printed 9 red weekly candles for the first time in the history of the asset.
The last 9 weekly candles:
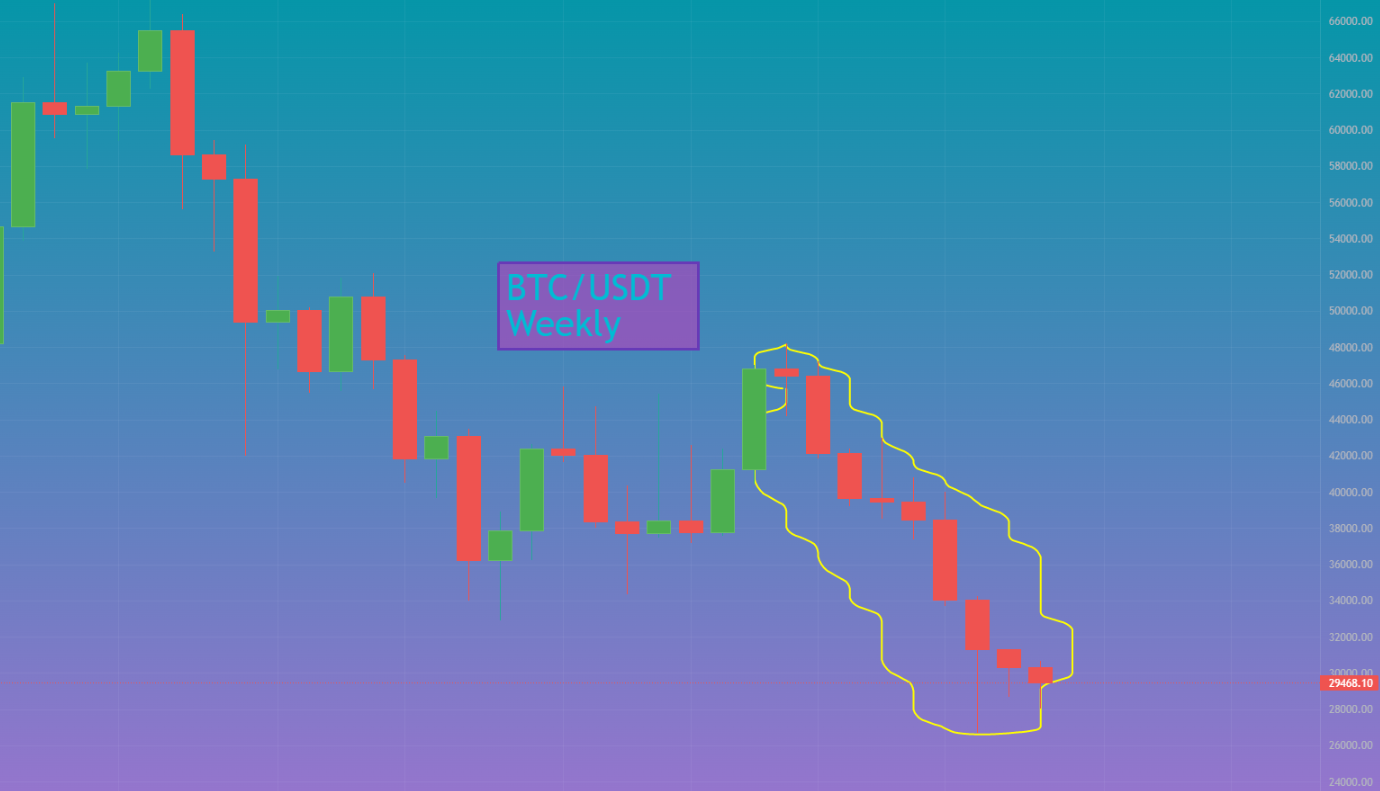
The optimal way to go about this.
Given the above situation, going long or short the market happens to be a coin toss for most right now. So what’s a safe bet for having exposure in crypto right now and minimizing loss? The answer isn’t really all that phenomenal or complicated, but it would be a simple DCA (Dollar Cost Average) into crypto assets with Kryll. This leaves you with the least amount of stress and a plan to accumulate the asset at various price levels with the aim of lowering average buy in price.

Happy Trading,
Website : https://kryll.io
Twitter : @Kryll.io
Telegram EN : https://t.me/kryll_io
Telegram FR: https://t.me/kryll_fr
Telegram ES: https://t.me/kryll_es
Discord : https://discord.gg/PDcHd8K
Facebook : https://www.facebook.com/kryll.io
Support : support@kryll.io