In front of a chart, your eye never rests on price alone. It hunts for the moving average carrying the trend, the RSI starting to lose steam, or any other indicator traders swear by. Laid over the candles, they're what turn a column of numbers into a market you can actually read.
Except that, until now, the KryllOS editor's chart showed price, candles and volume, nothing more. Your indicators, meanwhile, ran inside your blocks without ever showing up on the candles.
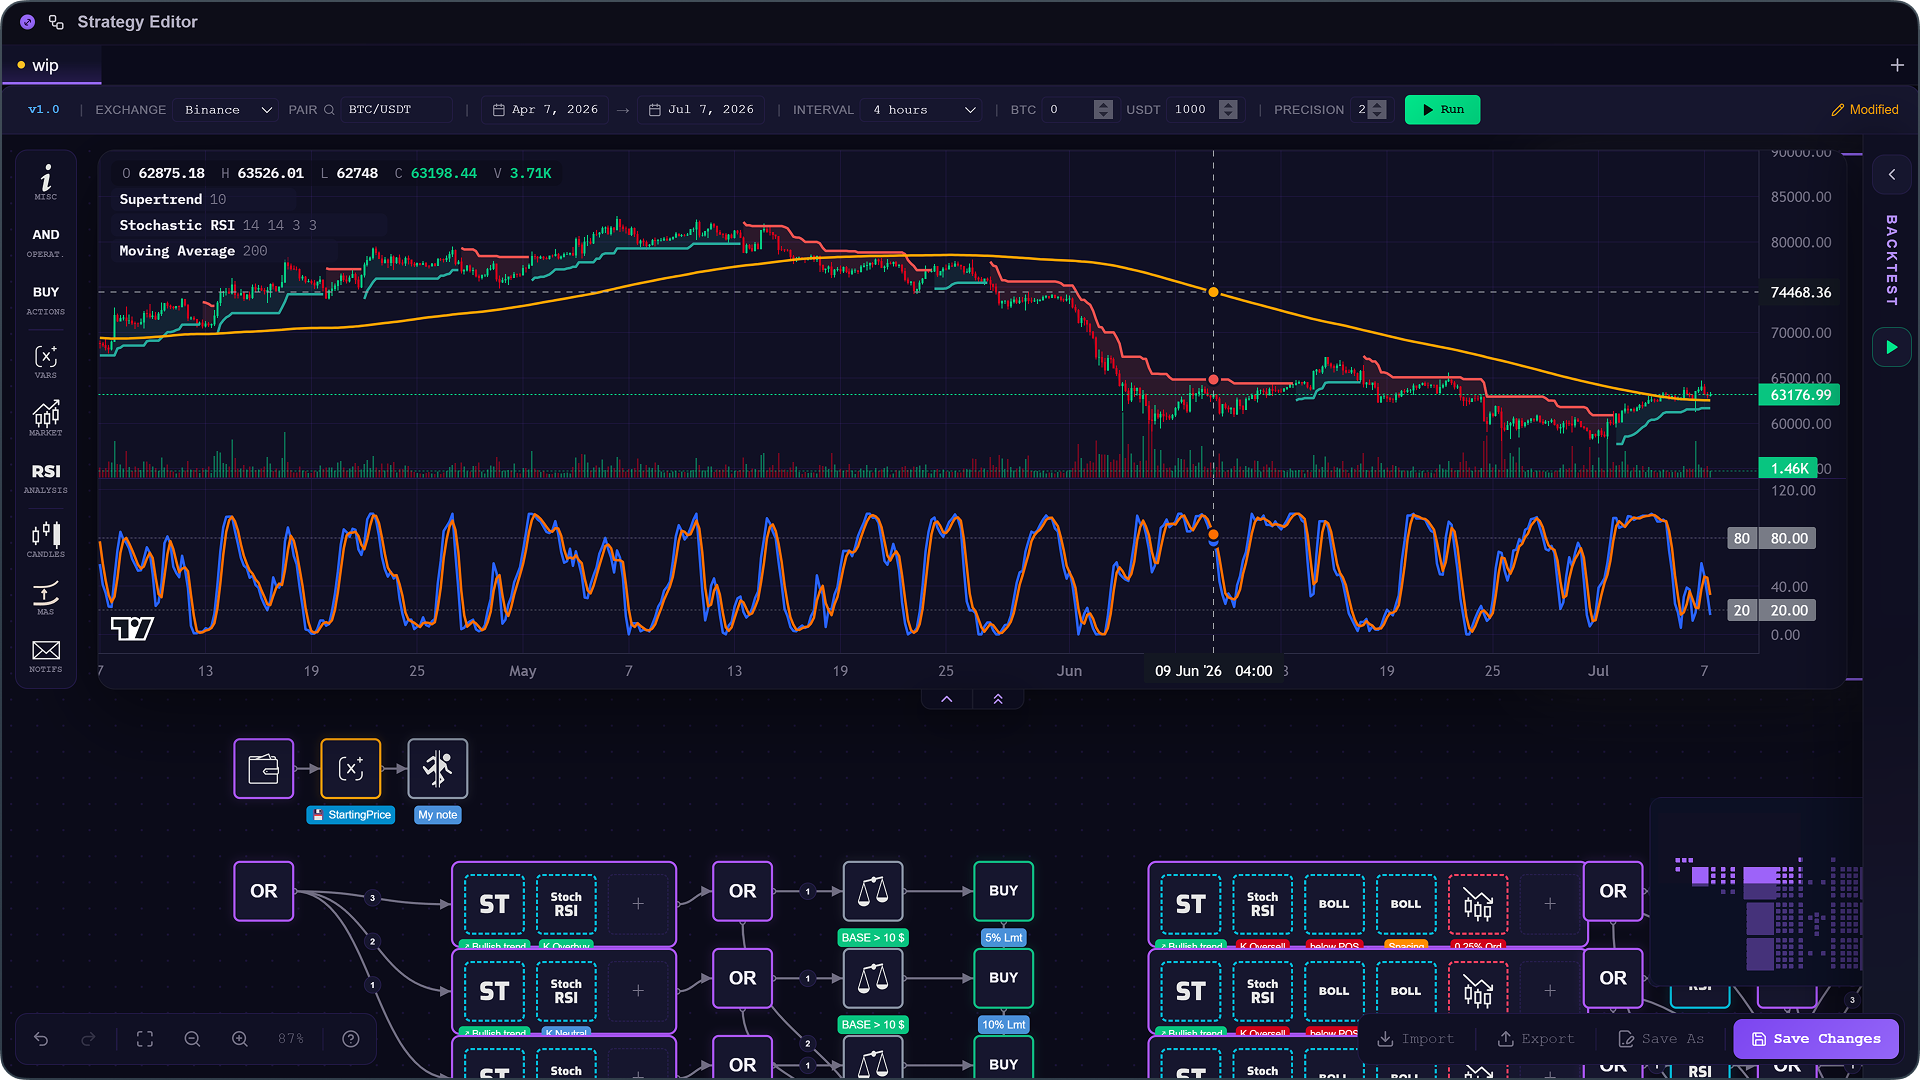
That's over now. As of KryllOS 0.5.26, technical indicators appear directly on your editor's chart, right there among the candles, while your strategy takes shape.
The resizable chart
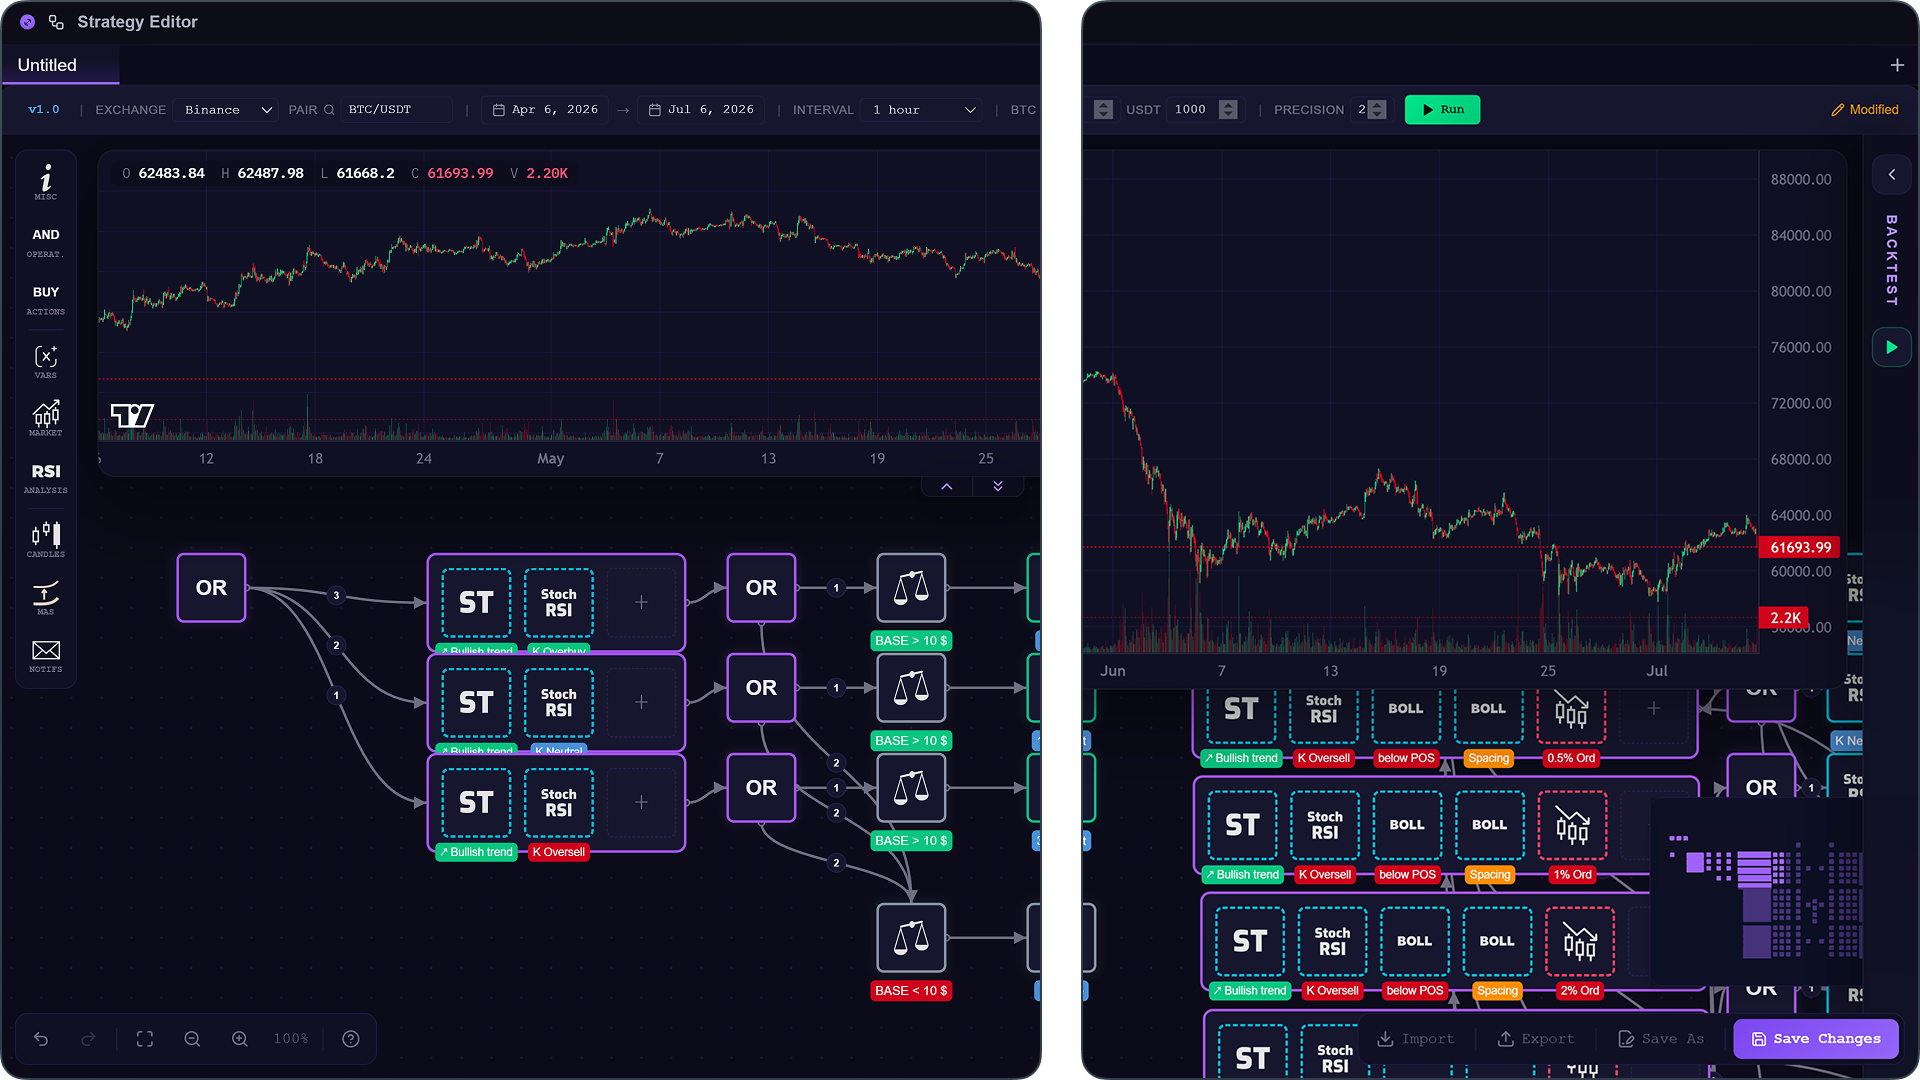
You could already open and collapse the chart above your strategy. What's new is that it now comes in two sizes. First a compact one, which leaves you enough room to keep wiring your blocks while keeping price in view. And a large one, which unfolds the chart and gives it more space for a real analysis session.
- Compact mode: you edit your blocks, the chart stays visible
- Expanded mode: a bigger chart, room for analysis
- Switch modes in one click
How to do it
- Find the double chevron ⩔ in the center, right at the bottom of the chart
- One click to expand it, another to go back to compact
Adding indicators
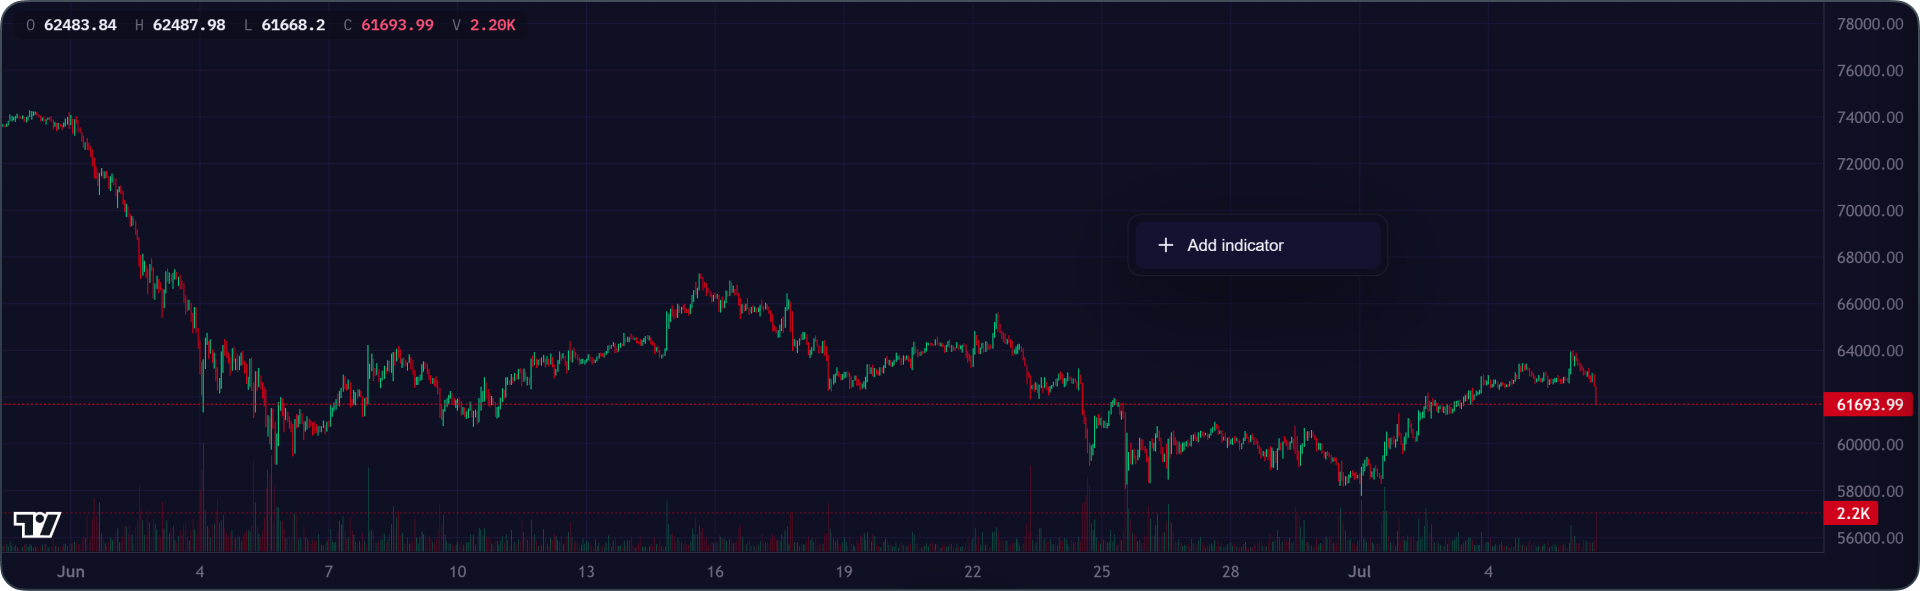
To add one, right-click on the chart and the list opens. You browse what's available or type its name to find it right away, you click, and it settles onto your candles. Nothing stops you from stacking several: a short moving average and a long one to watch for a cross, an RSI just below, a Supertrend over the price. The more you add, the more the chart's expanded mode becomes your friend.
- Search by name to go straight to it
- As many indicators as you want, stacked on the price
- Available indicators: Moving Average, RSI, MACD, Bollinger, Stochastic RSI, Supertrend, Ichimoku, Volume
How to do it
- Right-click anywhere on the chart
- In the list that opens, pick an indicator or type its name in the search
- Click it, and it drops onto the price
- Repeat to stack more
Managing and cleaning up your indicators
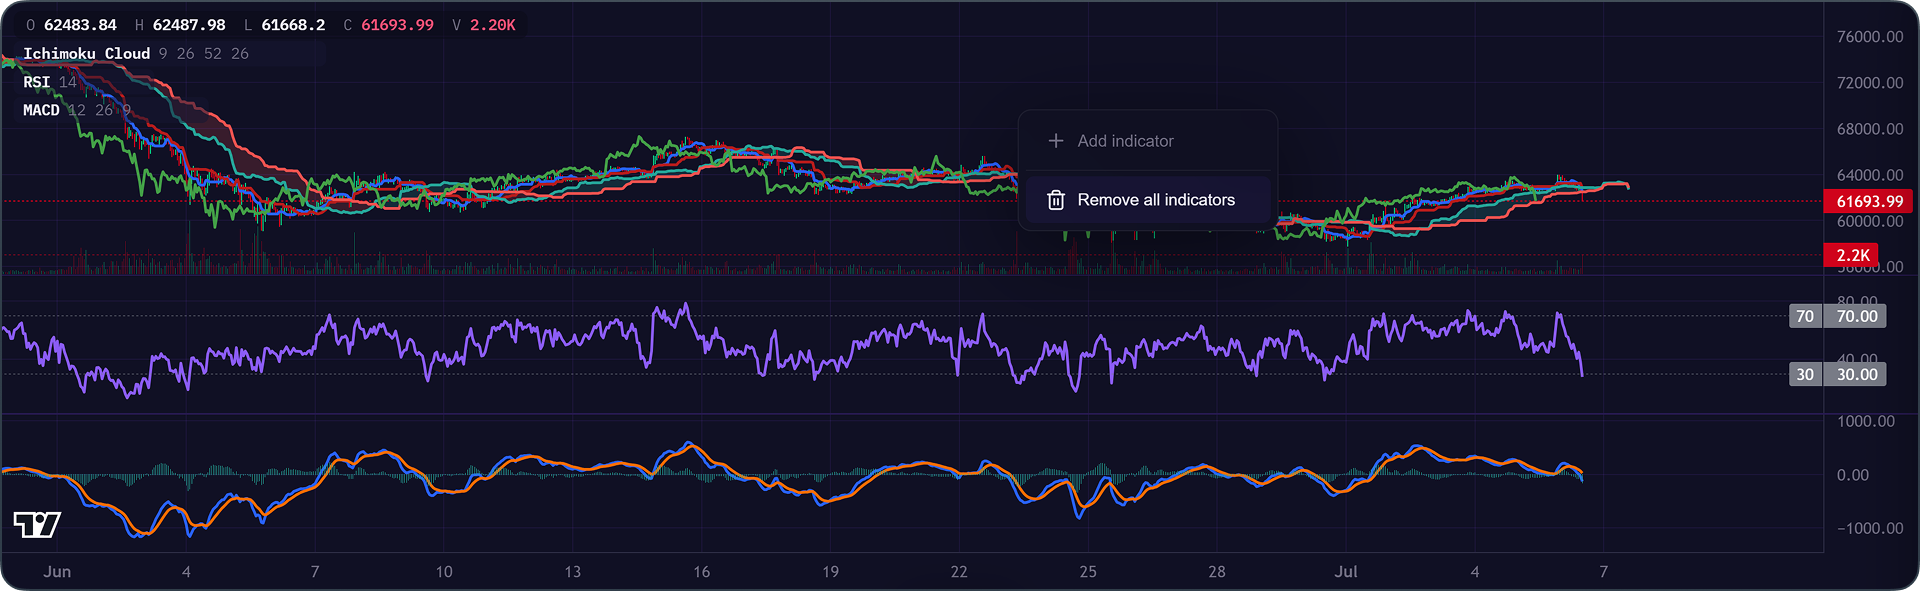
A busy chart needs a bit of tidying. You can hide an indicator to get it out of view without losing it, then bring it back the moment you need it again. You can also delete just one, the one you no longer need. And the day you want to start from a blank canvas, there's no need to remove them one by one: right-click the chart, choose to remove them all, and every indicator disappears at once. Two clicks, and you're starting fresh.
- Hide / show an indicator without losing it
- Delete a specific indicator
- Remove them all at once: right-click, then "remove all indicators"
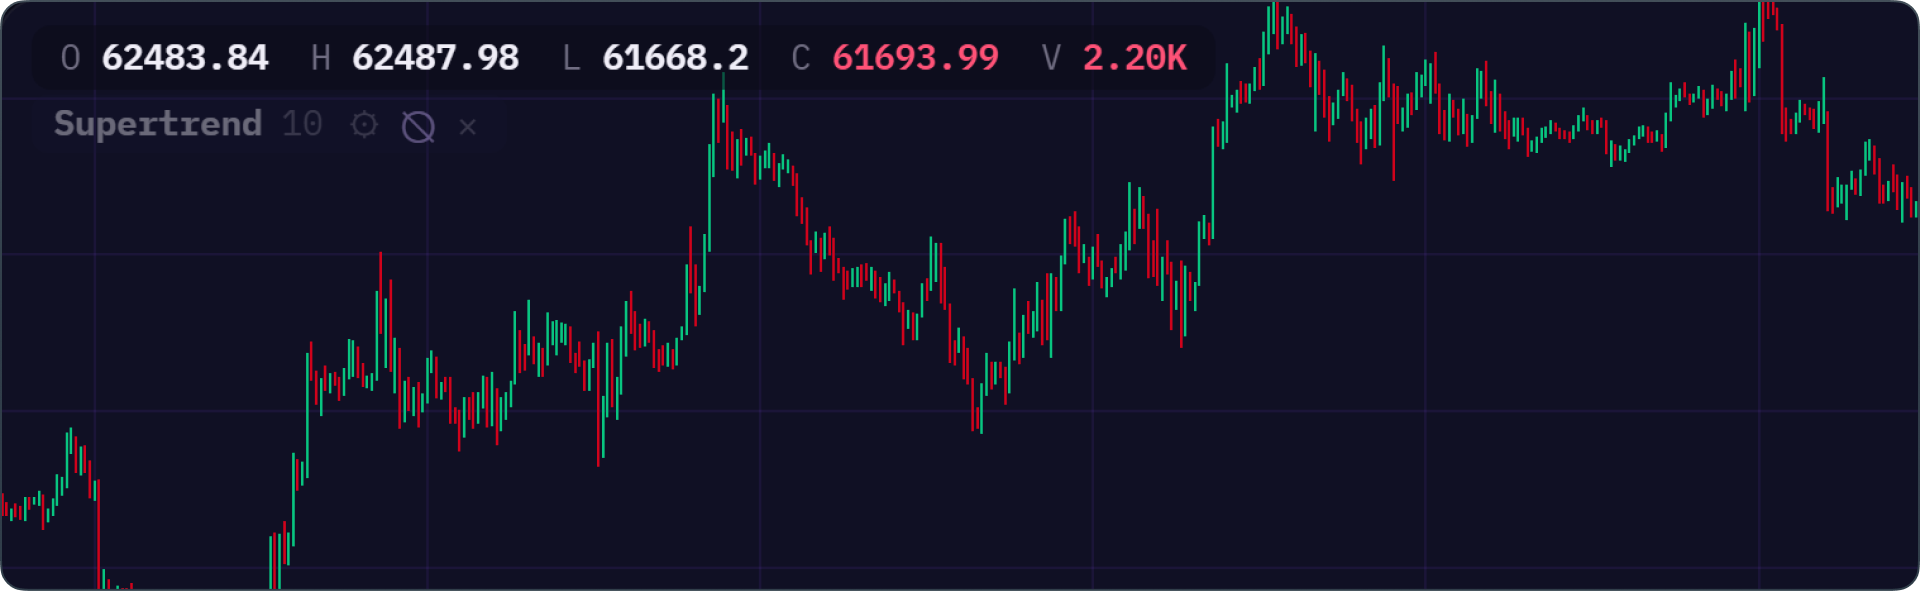
How to hide an indicator
- Hover over its name, at the top left of the chart
- Click the ◉ icon to hide it. Click again to bring it back
How to remove all indicators
- Right-click on the chart
- Click "remove all indicators". They all disappear at once
Customizing each indicator
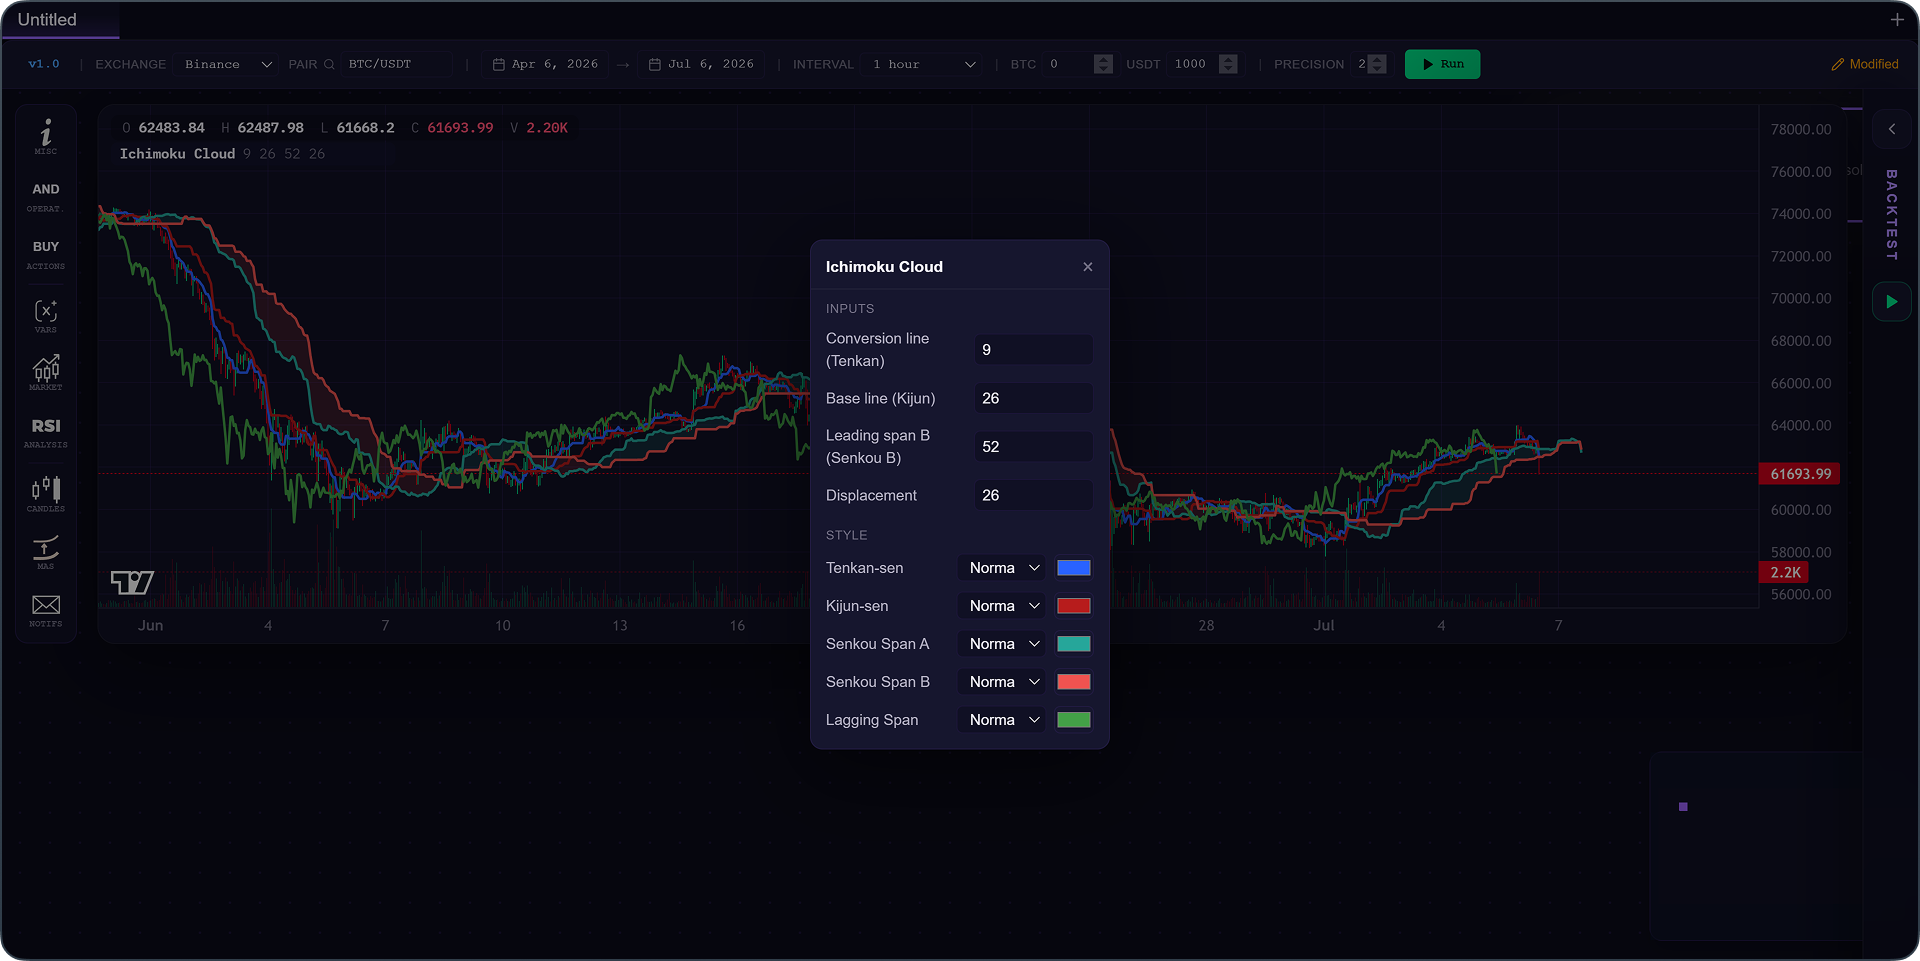
Each indicator opens onto its own settings panel, and you really can tweak all of it. You lengthen or shorten its period to set it anywhere from short term to very long term, you switch its calculation method when it offers several, you adjust the line thickness and its color, and you even choose the price source it works from, whether it starts from the close, the open, or one of the classic combinations traders are used to. Nothing is set in stone. You set up each indicator exactly the way you read it in your head, with your own reference points and your own way of trading.
How to do it
- Hover over the indicator and click the gear ⚙
- Adjust whatever you want in the panel (period, style, color, source...)
- Changes apply directly on the chart
Reading values on hover
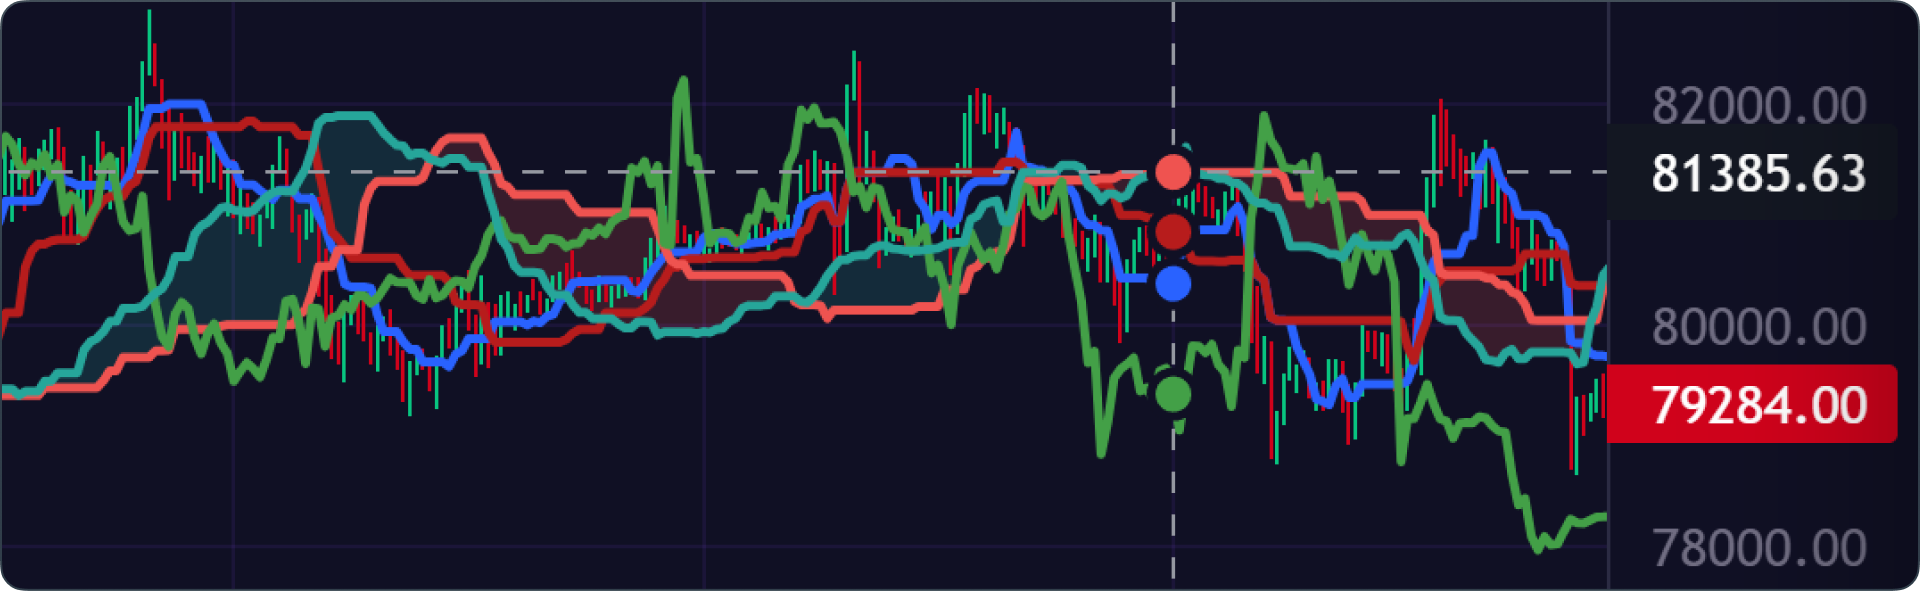
Move your mouse over the chart and your indicators hand you their numbers. A dot snaps onto the curve, and its exact value appears off to the side, at the precise moment you care about. Enough to read the value of your moving average or your Supertrend down to the exact candle, without ever drowning the chart in numbers.
How to do it
- Move your cursor over the chart
- Each indicator's value appears at the point you're hovering over
In the end, all these settings and shortcuts come down to one simple idea: your technical analysis and your strategy now live in the same space. And that's the whole point: you no longer build your strategy by imagining what your indicators are doing, you build it from what you see. The rest is yours to write. Update to 0.5.26, open your editor, and drop your first indicator onto the price ;)