

Introduction to the Relative Strength Index (RSI)
The Relative Strength Index, commonly referred to as RSI, is a popular tool in the technical analysis circles, offering insights into the momentum of market prices. Originating from the innovative work of J. Welles Wilder in 1978, this momentum oscillator gauges the speed and change of price movements, oscillating between values of 0 and 100. The RSI is not just a mere number; it provides traders with a lens to view the underlying strength or weakness of a market, helping them decipher whether a cryptocurrency is overbought or oversold.
Understanding the Mechanics of RSI
How RSI Works and Its Mathematical Formula
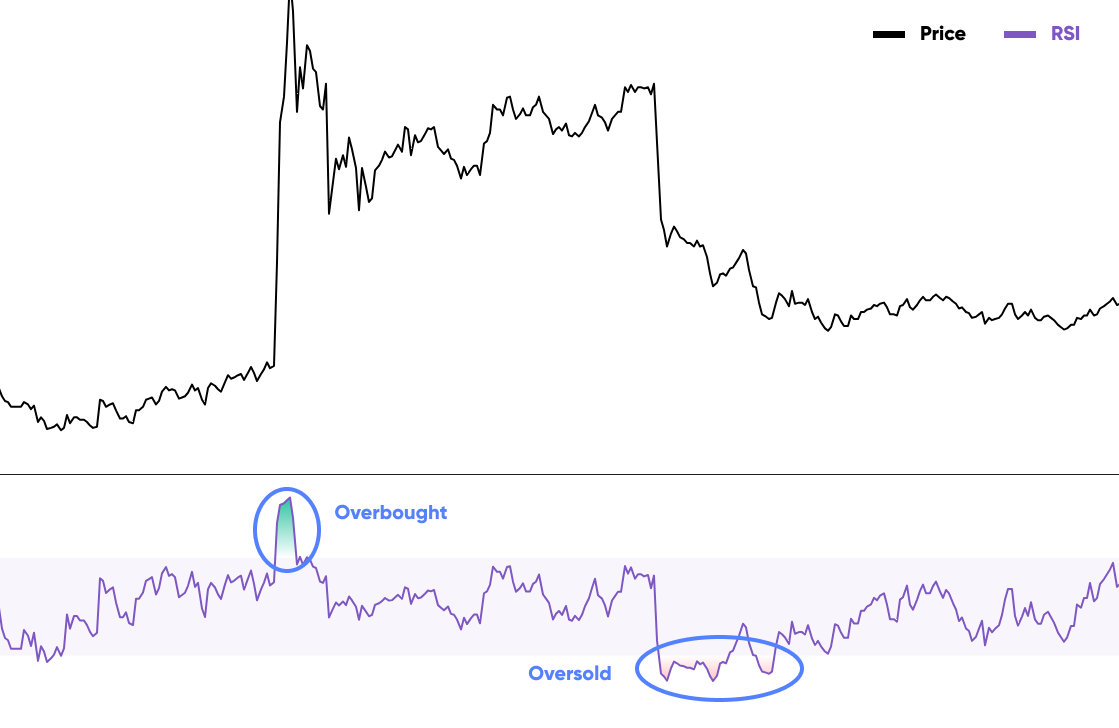
The essence of RSI lies in its ability to measure recent price fluctuations, thereby determining the relative strength or weakness of a particular cryptocurrency. The RSI value is presented as a percentage, typically plotted on a graph beneath the price chart. This graph often features two parallel lines, representing channels that indicate when a market is oversold or overbought.
A cryptocurrency is perceived as oversold when it experiences sustained selling pressure, with the RSI suggesting an imminent upward rally. Conversely, when a cryptocurrency undergoes extensive buying, and the RSI indicates a potential downward correction, it is viewed as overbought.
The RSI's mathematical foundation is a formula that considers the average gains and losses over a specified period. The formula is given by:
[ RSI = 100 – \left( \frac{100}{1 + \text{Average gains of up periods / Average losses of down periods}} \right) ]
While this formula might seem intricate, traders typically don't need to compute the RSI manually. Modern trading platforms, like TradingView, have integrated the RSI, automating the calculations and presenting traders with real-time values.
RSI as a Momentum Oscillator
Interpreting RSI Values: Overbought vs. Oversold
The Relative Strength Index (RSI) serves as a momentum oscillator, effectively measuring the magnitude and velocity of price movements. Oscillating between values of 0 and 100, the RSI provides traders with a clear perspective on market conditions. Specifically, an RSI value above 70 typically indicates that an asset is overbought, suggesting that it might be due for a price correction. Conversely, an RSI value below 30 implies that the asset is oversold, hinting at a potential price rebound.
In the context of a robust uptrend, it's not uncommon for the RSI to consistently hover above 70. Similarly, during a pronounced downtrend, the RSI might remain below 30 for extended durations. This behavior underscores the importance of context when interpreting RSI values. For instance, in a bullish market, traders might look for buying opportunities when the RSI dips to oversold levels. In contrast, in a bearish market, overbought RSI levels can signal potential selling opportunities.
Furthermore, the 50-level on the RSI serves as a critical threshold. An RSI value above 50 indicates a prevailing buying momentum, suggesting a stronger bullish sentiment in the market. On the flip side, an RSI below 50 points to increased bearish momentum.
Divergences in RSI and Their Significance
Bullish and Bearish Divergences Explained
One of the nuanced ways traders utilize the RSI is by identifying divergences. A divergence arises when the price movement of an asset and the RSI trajectory don't align. Specifically, a bullish divergence is observed when the asset's price forms lower lows, while the RSI charts higher lows. This divergence indicates that, despite the price downtrend, the selling momentum is waning, potentially signaling an upcoming bullish reversal.

Conversely, a bearish divergence emerges when the asset's price achieves higher highs, but the RSI fails to follow suit, instead forming lower highs. This scenario suggests that the buying momentum is diminishing, even if the price is on an uptrend, hinting at a possible bearish reversal in the near future.
However, it's crucial to approach RSI divergences with caution. While they can be indicative of potential trend reversals, they might not always be reliable, especially during strong market trends. For instance, a persistent downtrend might exhibit multiple bullish divergences before the actual market bottom is reached. As such, RSI divergences are most effective in markets with less volatility or subtle trend movements.
Practical Application of RSI in Crypto Trading
Tips for Using RSI Effectively in Trading Scenarios
The Relative Strength Index (RSI) is a versatile tool that can significantly enhance your crypto trading strategy when used correctly. Here are some practical tips for applying RSI in your crypto trades:
Entry and Exit Points: The RSI can guide traders on optimal entry and exit points. When the RSI goes below 30, it's often seen as a potential buying opportunity, indicating the asset might be undervalued. Conversely, when the RSI exceeds 70, it might be time to consider selling, as the asset could be overvalued.
Swing Trading: For those engaged in swing trading, the RSI can be invaluable. This strategy involves capitalizing on short-term price fluctuations. Traders might buy when the RSI dips below 30 and sell when it rises above 70. This method can be repeated, allowing traders to benefit from multiple price swings.
Identifying Divergences: Divergences between the RSI and price action can signal potential trend reversals. For instance, if a cryptocurrency's price hits a new high but the RSI doesn't, it could indicate weakening momentum and a potential price drop.
Support and Resistance Levels: The RSI can help pinpoint key support and resistance levels even before they become apparent on price charts. These levels represent points where the market resists moving above (resistance) or below (support).
Remember, while the RSI is a powerful tool, it's essential to use it in conjunction with other indicators and not rely on it exclusively.
Limitations and Considerations When Using RSI
The Importance of Combining RSI with Other Indicators
Like all trading tools, the RSI is not without its limitations.
Not Always Accurate for Trade Confirmations: While the RSI can identify overbought and oversold conditions, it doesn't always confirm if it's the right time to execute a trade. It's best used as an alert system, prompting traders to conduct further analysis.
Misleading in Strong Trends: During robust market trends, the RSI might remain in overbought or oversold territories for extended periods. This can mislead traders into thinking a reversal is imminent when it's not.
Varying Thresholds in Different Market Conditions: The traditional RSI levels of 30 (oversold) and 70 (overbought) might not always be the most appropriate. Depending on the market condition (bull or bear), traders might need to adjust these thresholds.
To mitigate these limitations, traders should combine the RSI with other technical indicators. For instance, the Moving Average Convergence Divergence (MACD) or various moving averages can complement the RSI, providing a more holistic view of the market.

Happy Trading,
Website: https://kryll.io
Twitter: @Kryll_io
Telegram EN: https://t.me/kryll_io
Telegram FR: https://t.me/kryll_fr
Telegram ES: https://t.me/kryll_es
Discord: https://discord.gg/PDcHd8K
Reddit: https://reddit.com/r/Kryll_io
Facebook: https://www.facebook.com/kryll.io
Support: support@kryll.io