
Introduction to the Supertrend Indicator
The Supertrend indicator is a technical analysis tool that has become popular for discerning the direction of market trends. This indicator is not just a instrument but a compass that guides traders through the uncertain trends in stocks, currencies, commodities, and of course, cryptocurrencies. It is a beacon that aims to signal the trend and provide traders with better entries and exits, helping us make more informed trading decisions.
The Supertrend indicator is akin to a craftsman's level, establishing dynamic support and resistance levels through its Upper and Lower Lines. These lines are not static; they dance to the rhythm of market volatility, adjusting their stance with the Average True Range (ATR), a measure of market volatility. This adaptability makes the Supertrend indicator a unique tool in a trader's arsenal, offering a lens that adjusts its focus in tandem with the market's capricious movements.
Understanding the Mechanics: Formula and Parameters
Delving into the mechanics of the Supertrend indicator, we encounter a concoction of simplicity and complexity. At its core, the indicator is a fusion of the Average True Range (ATR) and a multiplier factor, both of which are pivotal in its calculation. The ATR serves as the heartbeat of the indicator, measuring the market's volatility, while the multiplier factor is the dial that calibrates its sensitivity.
The Supertrend indicator calculates two lines on a price chart: the Upper Line, which is derived by adding the product of the ATR and the multiplier to the highest high over a set period, and the Lower Line, which is obtained by subtracting the product of the ATR and the multiplier from the lowest low over the same period. These lines are dynamic, ebbing and flowing with the tide of market volatility, providing a visual representation of potential trend continuations or reversals.
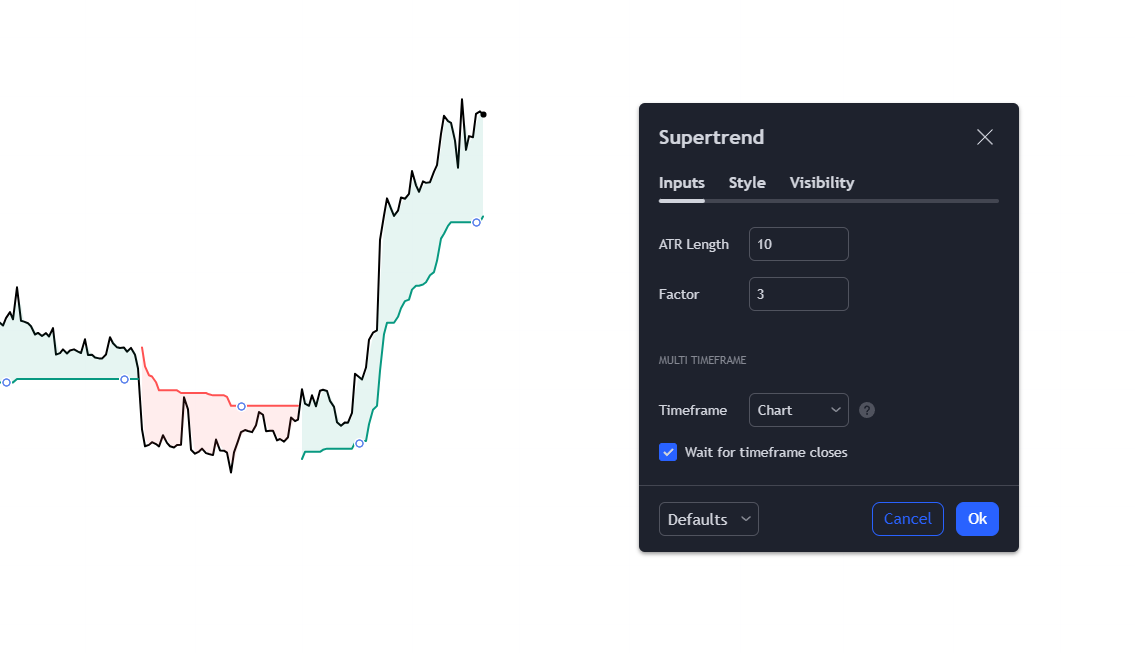
Traders can customize the Supertrend indicator by adjusting its two main parameters: the period length and the multiplier factor. The period length affects the sensitivity of the indicator to price movements, with a shorter period leading to a more responsive indicator, while a longer period results in a smoother line that is less prone to market noise. The multiplier factor determines the distance between the Supertrend lines and the price, influencing the indicator's tolerance to price fluctuations.
In essence, the Supertrend indicator is a tool of precision, allowing traders to tailor its settings to match their trading style and the characteristics of the market they are navigating.
Technical Analysis and Trading Signals
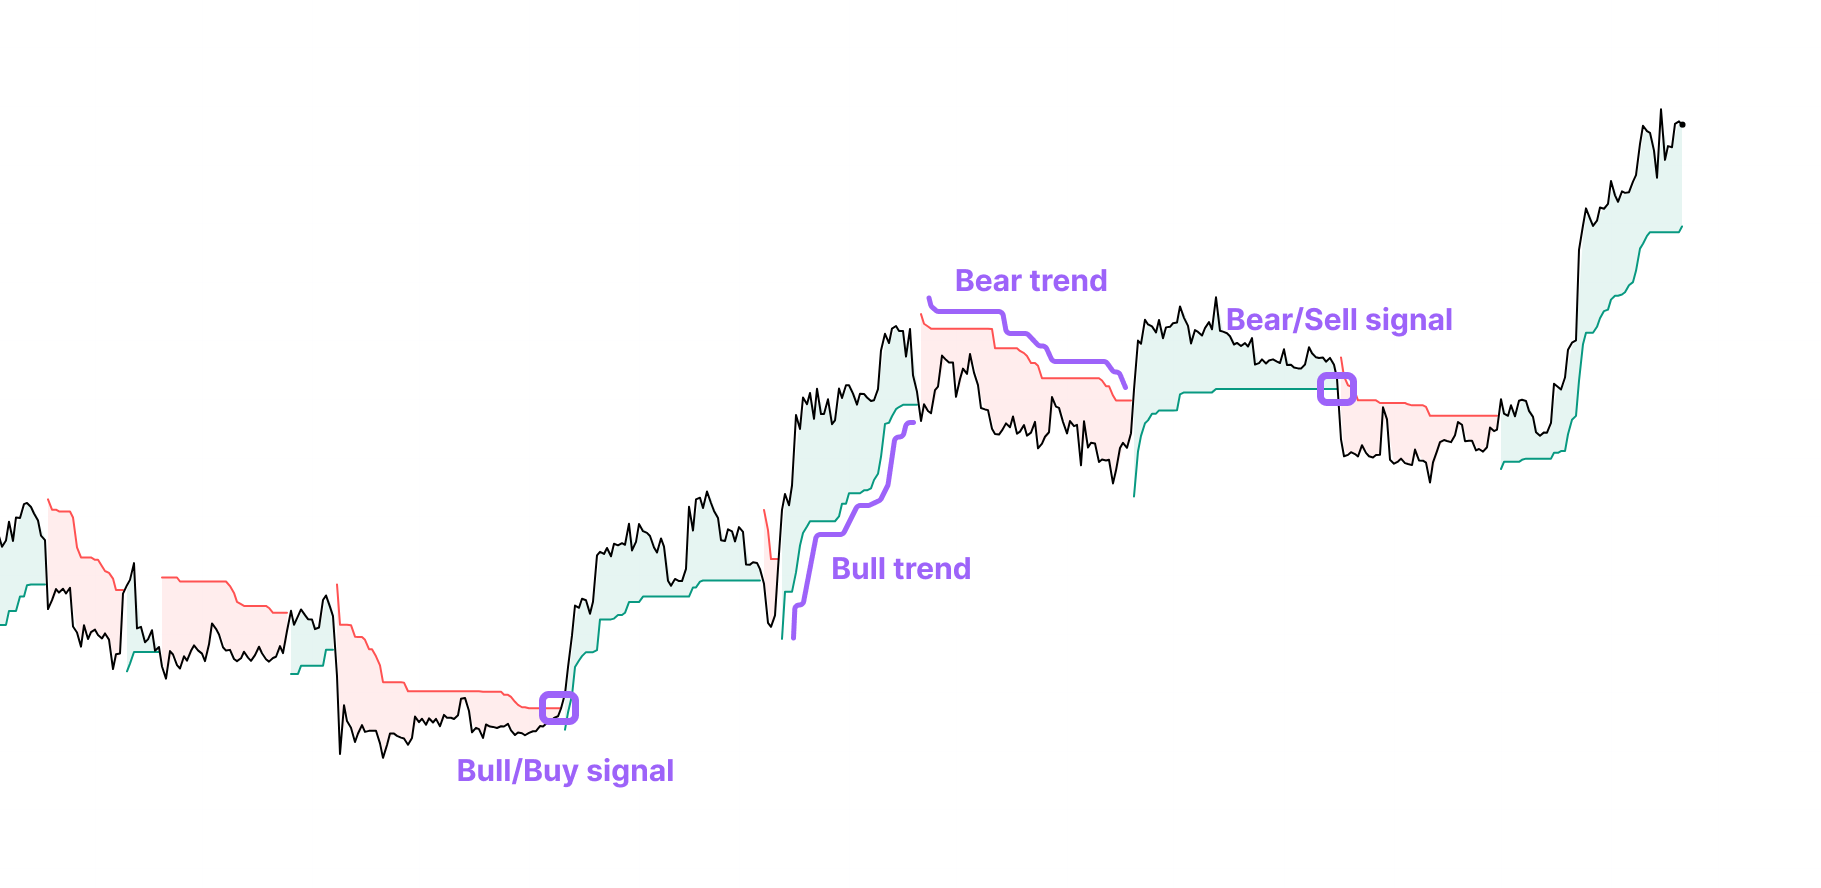
The Supertrend indicator emerges as a formidable tool for technical analysis, offering traders a dynamic and intuitive method to discern the direction of market trends. This indicator is particularly renowned for its ability to adapt to market volatility, utilizing the Average True Range (ATR) to calibrate its sensitivity to price fluctuations. The essence of the Supertrend lies in its dual-line mechanism, where the upper and lower lines serve as dynamic thresholds that signal potential entry and exit points for trades.
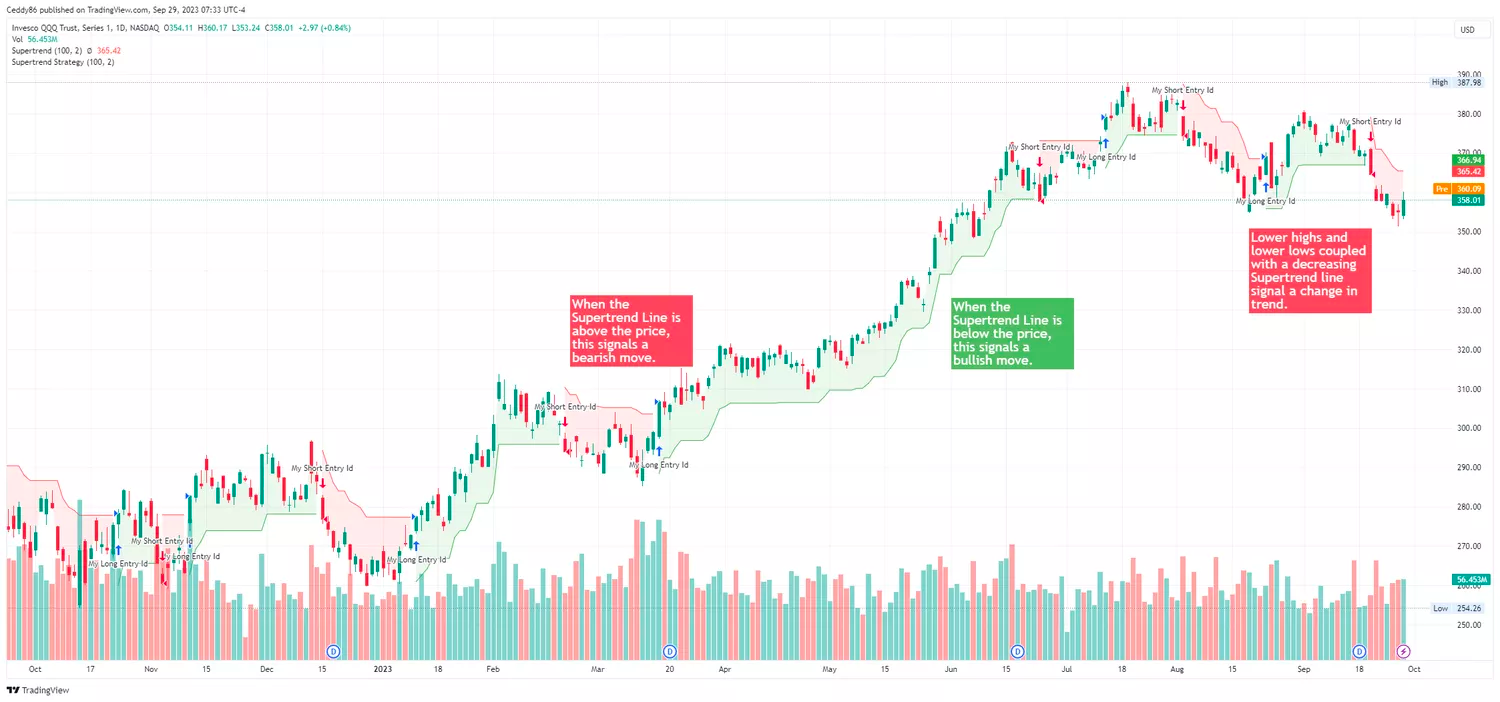
When the price of an asset surges above the Supertrend upper line, it is often interpreted as a bullish signal, suggesting that the asset's price may continue to ascend, thus presenting a potential buy opportunity. Conversely, a dip below the Supertrend lower line may be perceived as a bearish harbinger, hinting at a possible continuation of a downward trend and a sell signal. Traders leverage these crossover points to strategize their market entries and exits, aligning their actions with the prevailing trend direction indicated by the Supertrend.
Supertrend in Action: Practical Trading Strategies
The practical application of the Supertrend indicator in trading strategies is both an art and a science. Traders often customize the indicator's parameters, such as the period length and the multiplier factor, to align with their unique trading styles and the specific characteristics of the market they are navigating. A shorter period length can increase the indicator's responsiveness to price changes, while a longer period may yield a smoother line less prone to market noise.
A quintessential strategy involves entering a long position when the price momentarily dips below the Supertrend upper line in an uptrend, suggesting a potential retracement and buying opportunity. Conversely, a short position might be considered when the price momentarily rises above the Supertrend lower line in a downtrend, indicating a retracement and selling opportunity.
Risk management is a cornerstone of using the Supertrend indicator effectively. Traders often set stop-loss orders just below the Supertrend upper line for buy trades or above the lower line for sell trades to safeguard against sudden trend reversals. Moreover, the integration of other technical indicators, such as the RSI or MACD, can provide additional confirmation of Supertrend signals, enhancing the robustness of the trading strategy.
In these market movements, the Supertrend indicator serves as a versatile partner, guiding traders through the ebbs and flows of price action with clarity and precision. Its ability to adapt to changing market conditions makes it a valuable asset in the trader's toolkit, providing a structured approach to capturing trends and optimizing trade entries and exits.
Key Takeaways for Traders
Trend Identification: The Supertrend indicator excels in identifying the prevailing market trend, offering dynamic support and resistance levels that adapt to market volatility. This feature is particularly beneficial for traders who rely on trend following strategies.
Signal Clarity: With its straightforward visual cues, the Supertrend provides clear entry and exit signals. A price crossover above the Supertrend line suggests a potential buy, while a crossover below indicates a sell opportunity.
Volatility Adjustment: By incorporating the Average True Range (ATR), the Supertrend indicator adjusts to the changing market volatility, making it a flexible tool for different market conditions.
Risk Management: The indicator can aid in setting stop-loss orders, with the Supertrend lines serving as a guide for placing these orders just below or above the current trend line, thus helping to mitigate potential losses.
Complementary Tool: While the Supertrend can be used as a standalone indicator, it is often more effective when combined with other technical analysis tools, such as RSI or MACD, to confirm signals and refine trading strategies.
Supertrend vs. Other Technical Indicators
Parabolic SAR: Unlike the Parabolic SAR, which places dots on the price chart to indicate potential stop and reverse points, the Supertrend uses two lines to provide a more comprehensive view of potential support and resistance levels.
Sensitivity to Market Conditions: The Supertrend's reliance on ATR allows it to be more responsive to volatility changes compared to the Parabolic SAR, making it a more adaptable tool for traders who need to account for market dynamics.
Signal Interpretation: The Supertrend indicator offers a simpler interpretation of trends and potential trade opportunities through its line crossovers, whereas the Parabolic SAR's dot placements may require a deeper understanding of price movements and trend reversals.
Versatility: The Supertrend is versatile in its application across various asset classes, including stocks, currencies, commodities, and cryptocurrencies, due to its ability to adapt to different levels of volatility and market conditions.
Customization: Traders have the flexibility to adjust the parameters of the Supertrend indicator, such as the period length and multiplier factor, to suit their individual trading styles and the characteristics of the market they are trading.
In conclusion, the Supertrend indicator is a robust tool for traders seeking to capitalize on market trends. Its adaptability to volatility and clear signaling mechanism make it a valuable addition to a trader's toolkit. However, its effectiveness is enhanced when used in conjunction with other technical analysis tools, and like any indicator, it is not immune to producing false signals, especially in less trending, more sideways markets.
Disclaimer
This article is for informational purposes only and should not be taken as financial advice. It is important to note that no trading indicator, including the Supertrend indicator, guarantees profits. Trading involves risks, and decisions should be made based on individual due diligence and consultation with a financial expert. The author and publisher bear no responsibility for any trading losses incurred.

Happy Trading,
Website: https://kryll.io
Twitter: @Kryll_io
Telegram EN: https://t.me/kryll_io
Telegram FR: https://t.me/kryll_fr
Telegram ES: https://t.me/kryll_es
Discord: https://discord.gg/PDcHd8K
Reddit: https://reddit.com/r/Kryll_io
Facebook: https://www.facebook.com/kryll.io
Support: support@kryll.io