Developing and fine tuning your trading system is a complicated process. The previous solutions offered some time ago with deep analysis, required a tedious process of going to a separate web page, managing strategy versions, manually having them organized and using copies of the strategies and downloading the .kryll files. But now, things have gotten a lot easier.
The Kryll team now offers you a solution to these drawbacks with an improved tool to replace the old analysis.
Analysis 2.0 - Simplified and Optimized
The platform now offers all the power of the "Deep Analysis" module within the strategy editor, in a compact and efficient version.
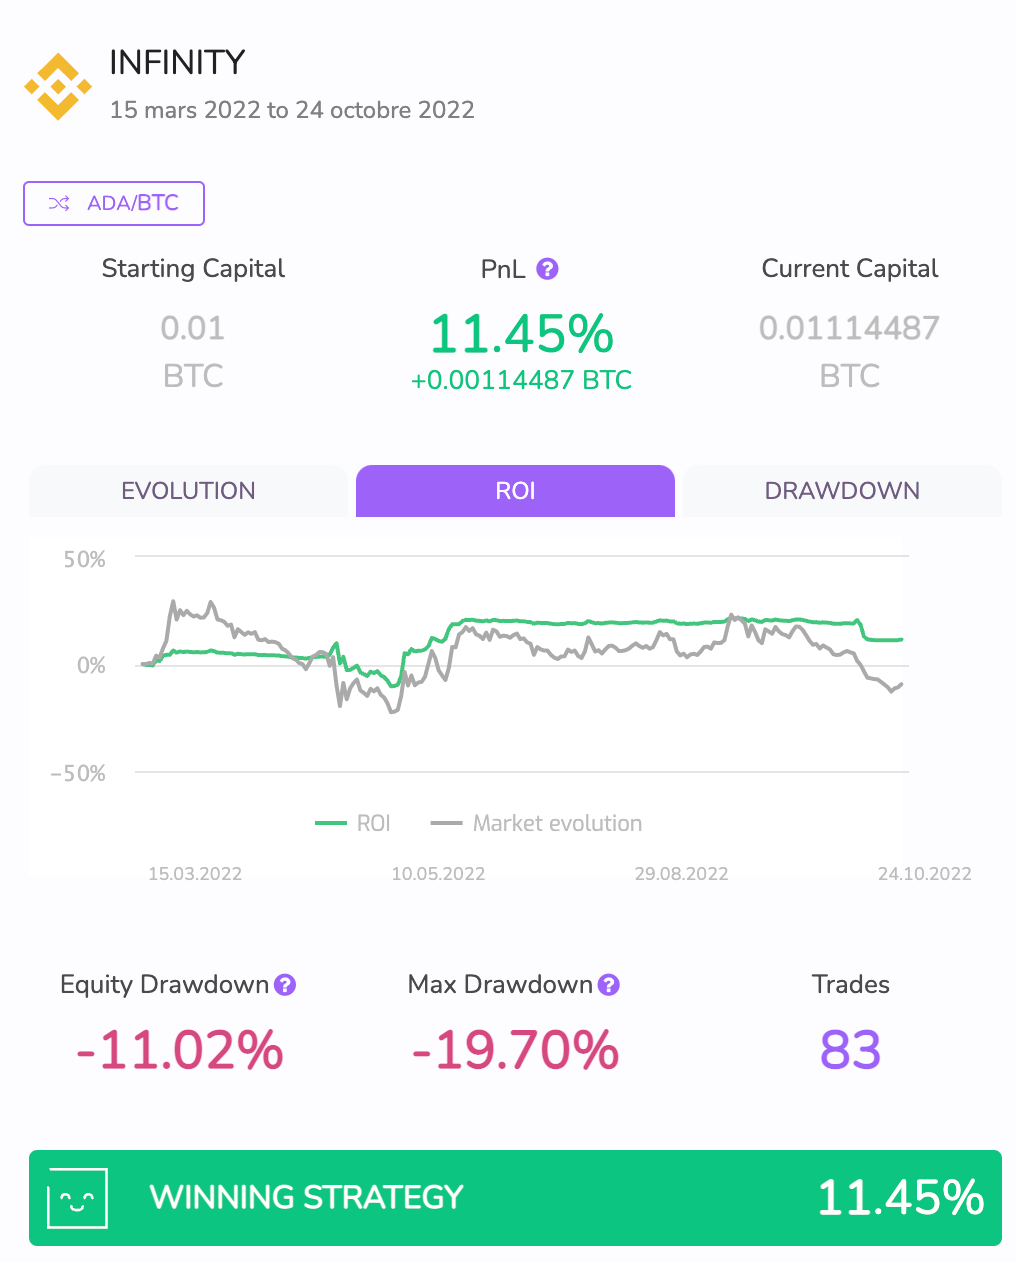
You may recognize most of these indicators from the in-depth analysis. If not, I suggest you read the other article on this topic, available here.
In this new analysis, the strategy performance indicators will update in real time for live strategies as well, showing you how the strategy is performing instantly.
Available Indicators
Analysis 2.0 has three charts:
1 - Return on Investment Graph
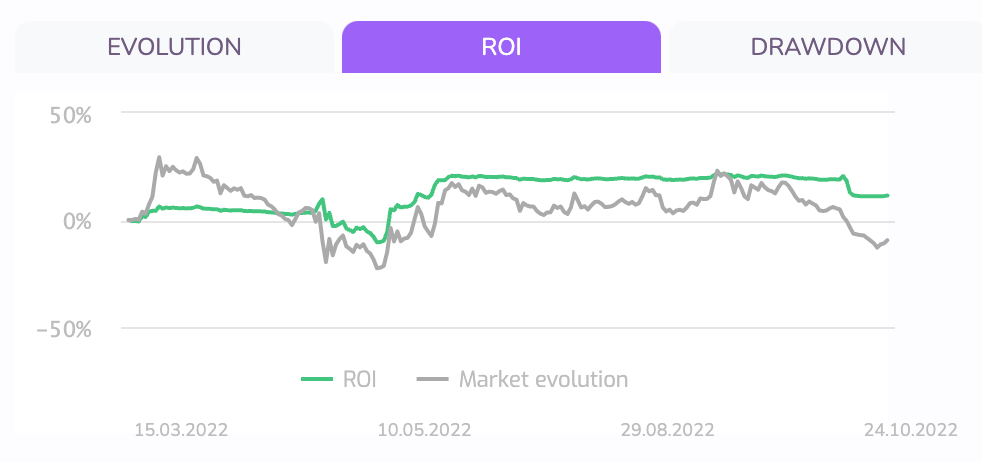
The RoE (return on equity) graph shows the evolution of the strategy's performance and allows you to compare it with the performance of the market. This curve is particularly effective for analyzing the performance of strategies through the market's up and down cycles.
2 - Drawdown Chart
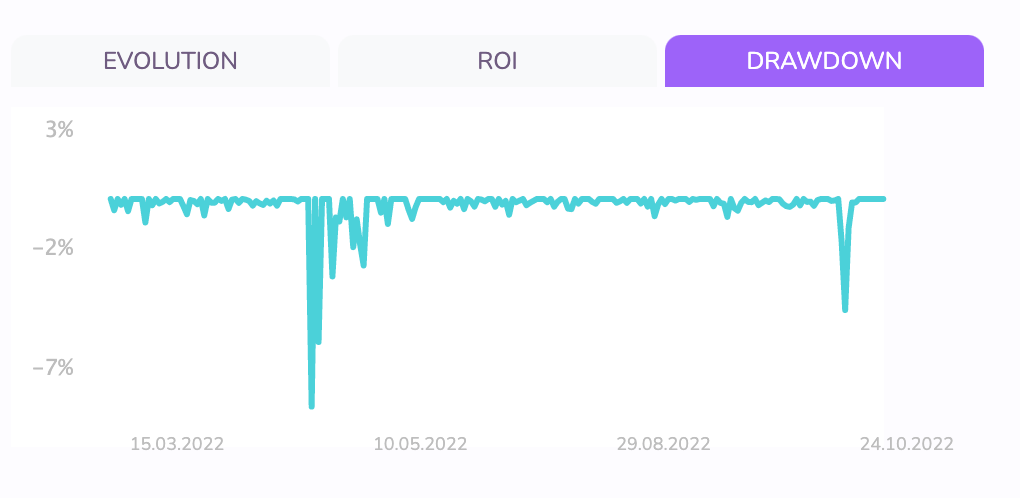
The Drawdown graph shows the maximum loss of the strategy on a day-to-day basis. It is a useful indicator to analyze the risk of the strategy over time.
3 - Equity Evolution Chart
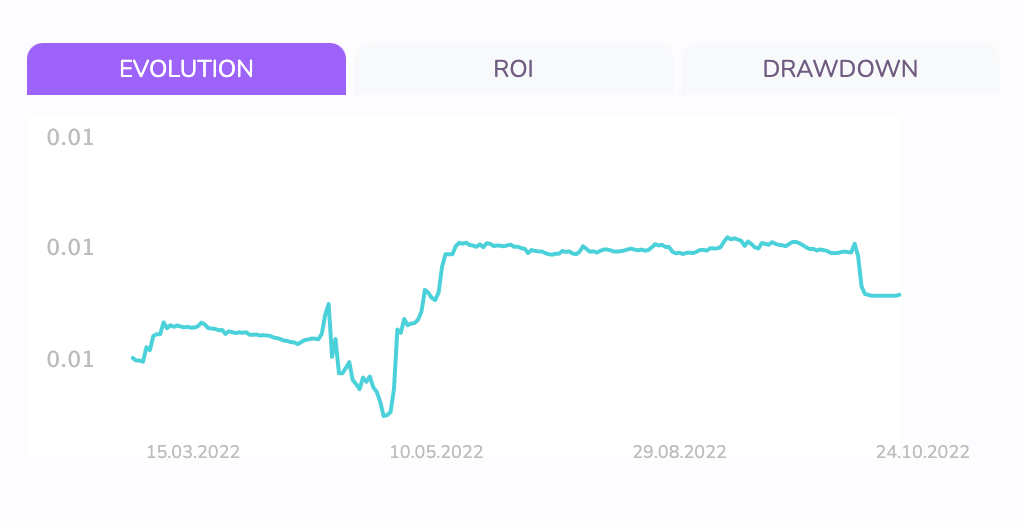
The evolution graph resembles the RoE graph, since it shows the evolution of the strategy's portfolio, converted into the selected asset.
The Kryll Workbench
The most interesting feature of this version of the editor is without a doubt the Kryll Workbench. If you have ever had trouble managing the versions of your strategy during its development, you will love this tool! Indeed, you can now save snapshots of the backtests performed with a version of the strategy you are working on and find them instantly.
Here is the current list of what you can do with the Workbench:
- Save the results of backtests on different pairs.
- Save the strategy versions of these backtests.
- Download the complete workbench.
- Import a workbench that you have downloaded or that has been provided to you.
How it works in a few lines
First of all, you have to create your strategy with your favorite indicators, and launch your first backtest. You will see the Analysis 2.0 in the analysis tab and a "arrow" button on the left of it.
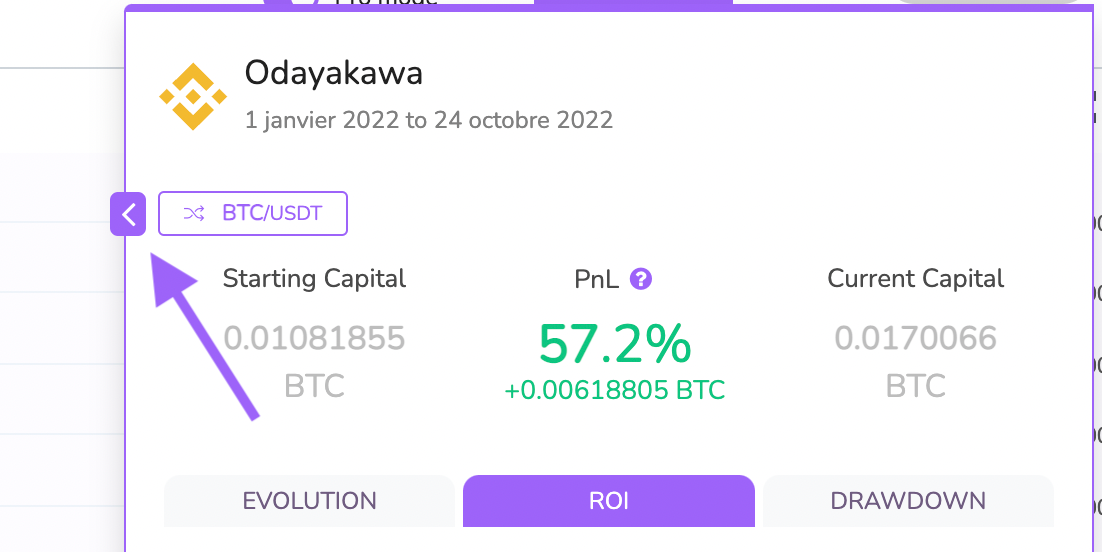
As you click on it, a brand new menu will open, the Workbench.
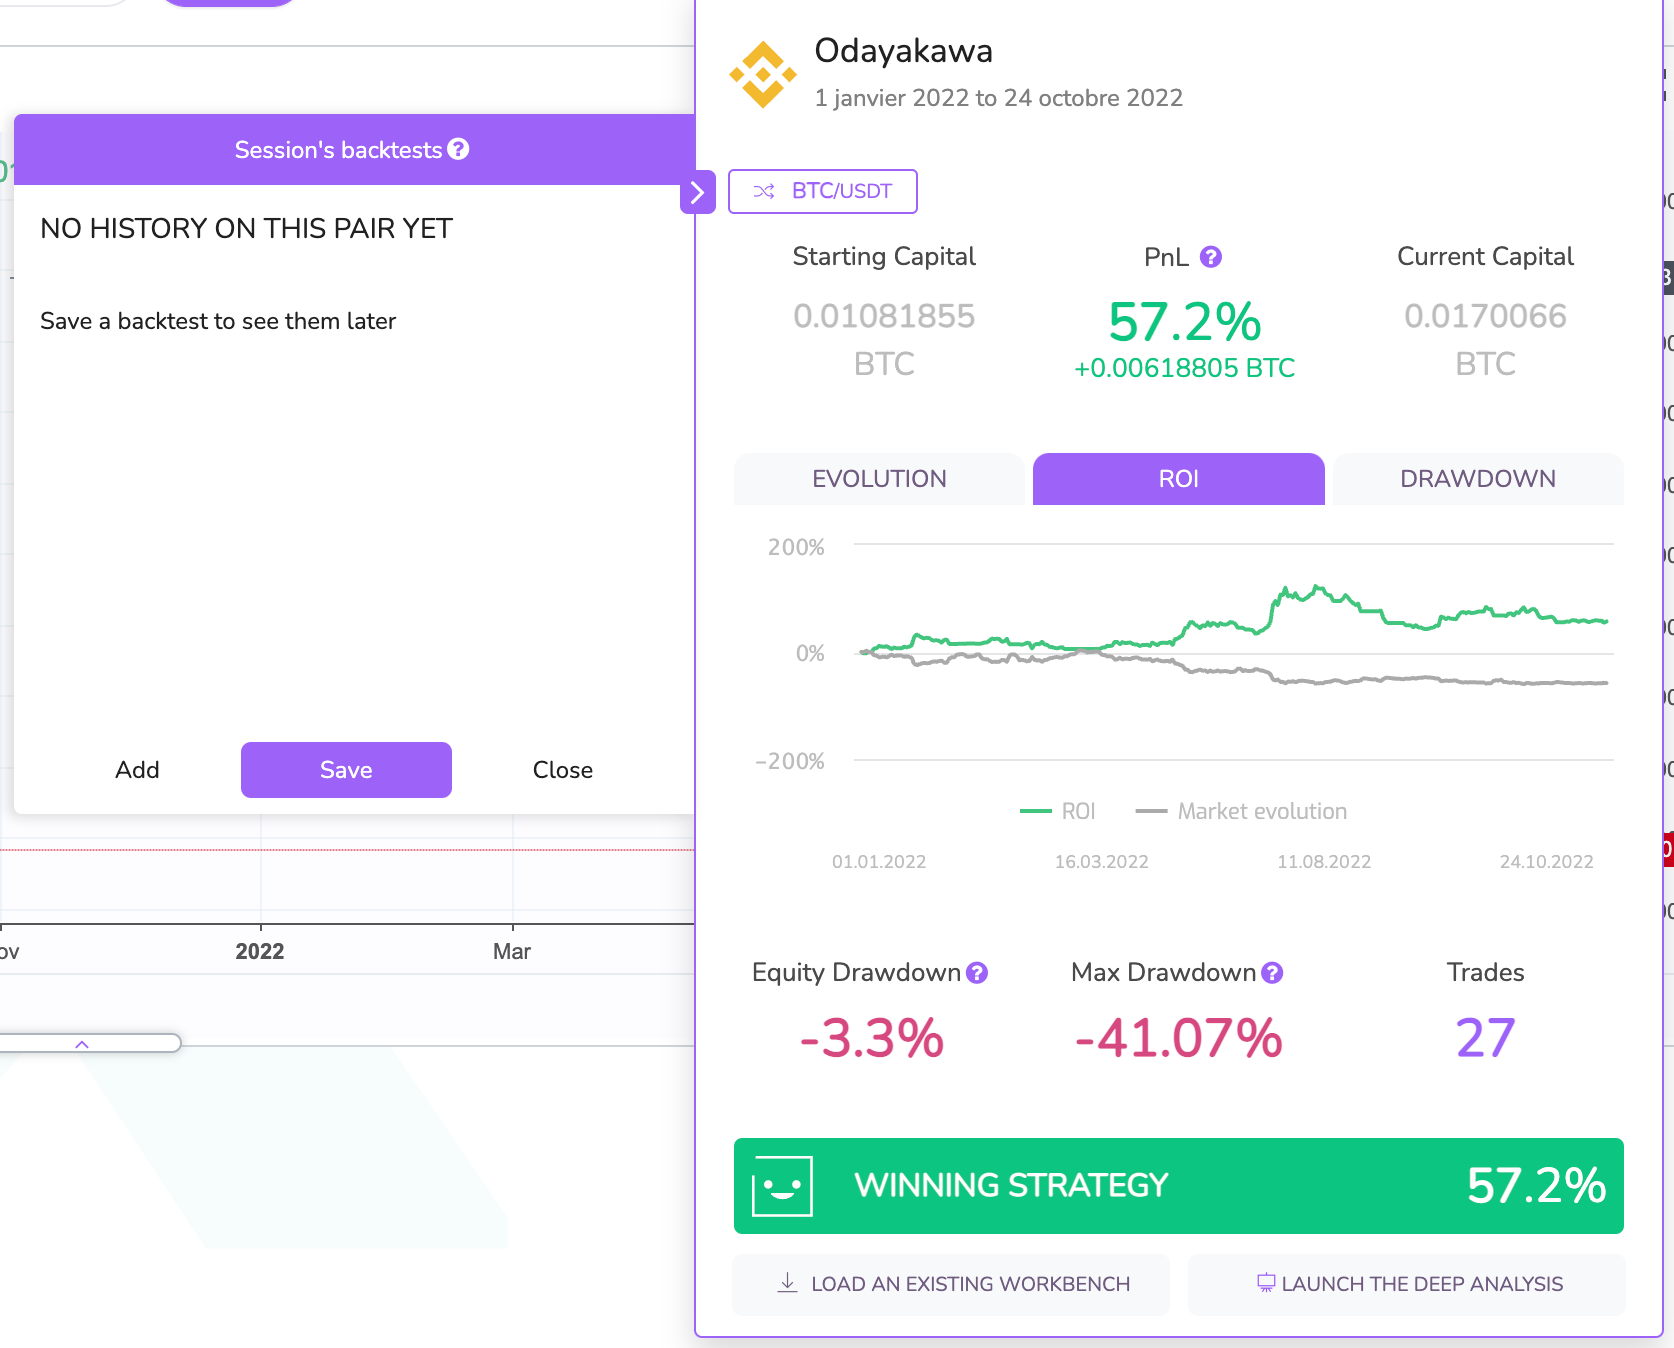
By clicking on "Add", you will save a "snapshot" of your current backtest and the state of the strategy at that moment. This will allow you to save and revisit it later.
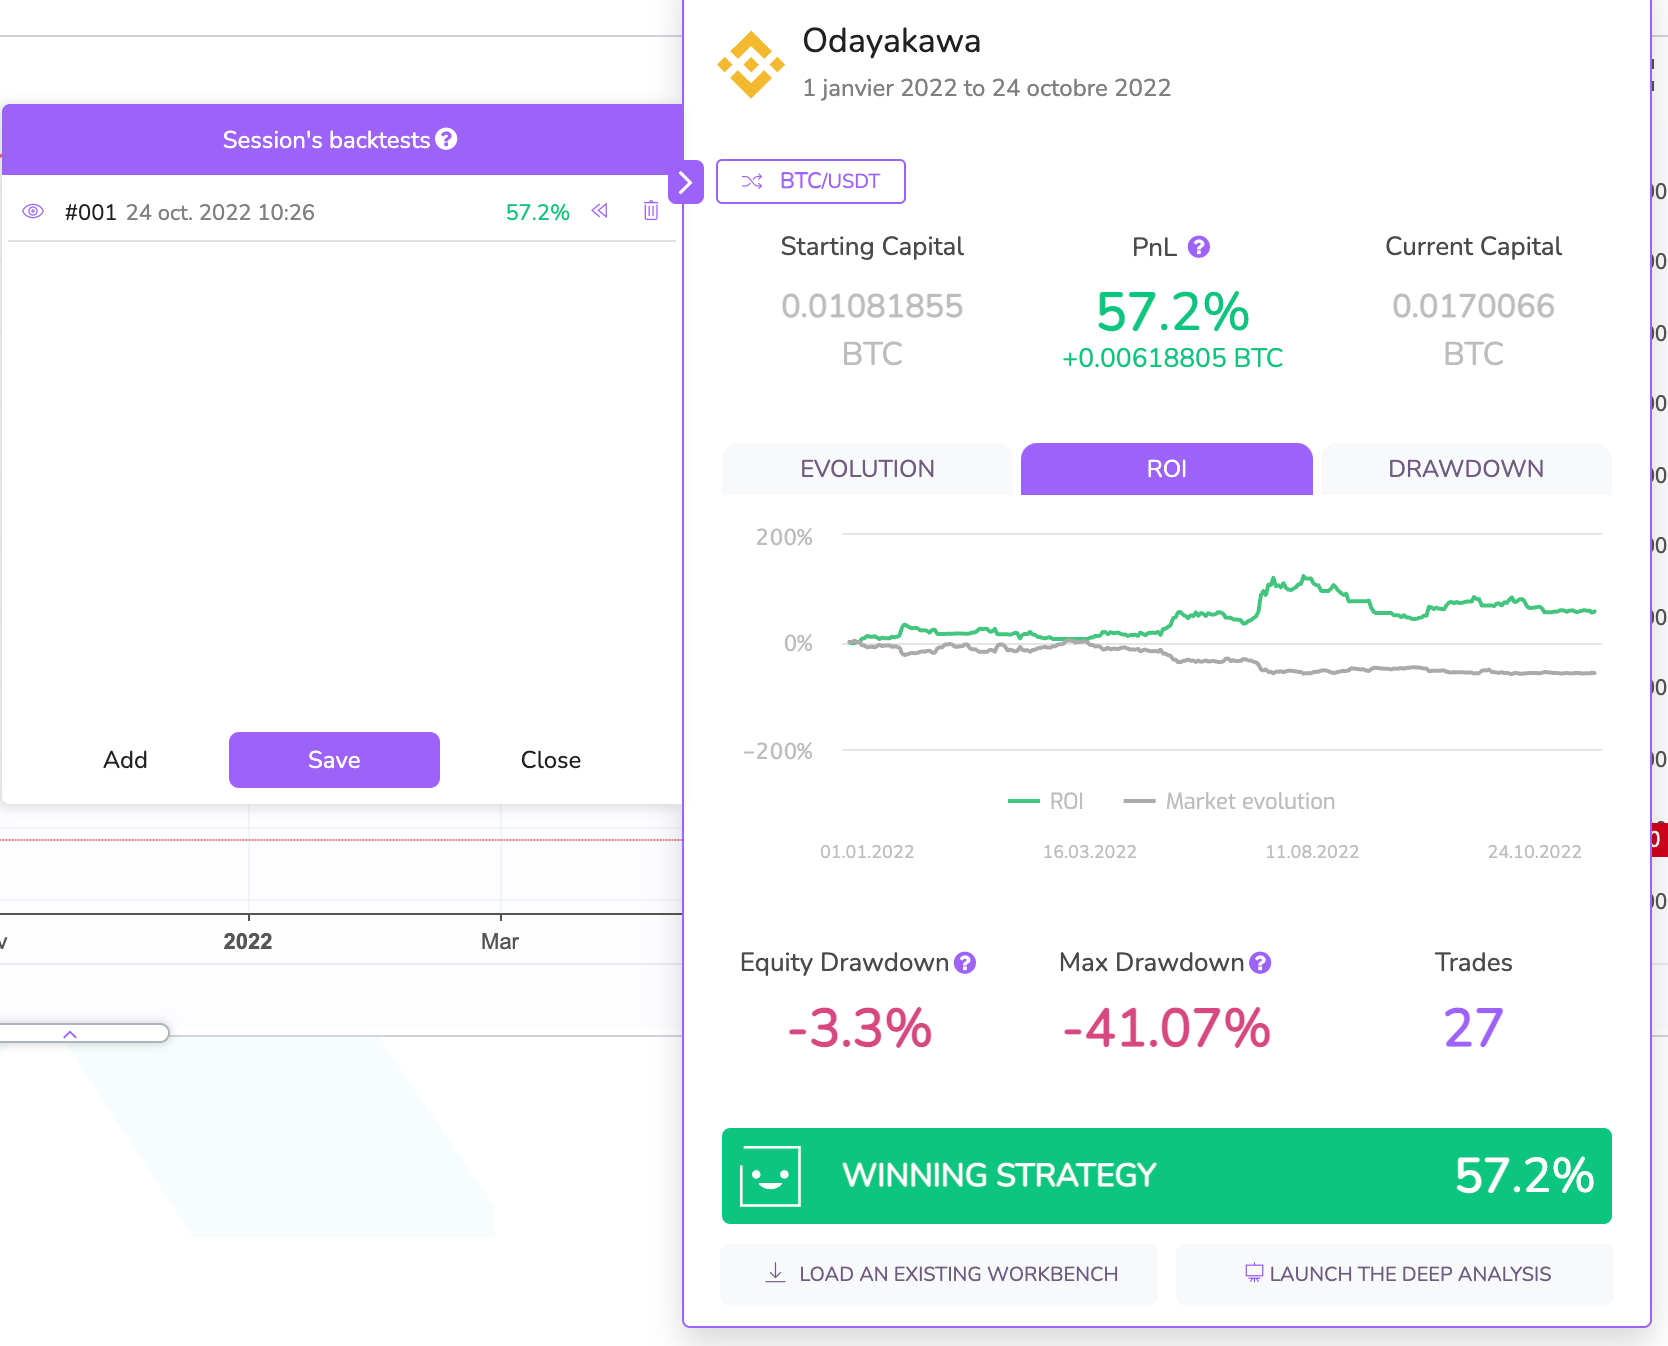
You can now switch from one version to another of your strategies by clicking on the back icon or check their differing results by hovering over them. You can delete an obsolete or non-performing version by clicking on the "trash" icon.
The "Save" button allows you to download your Workbench to your computer for later use or sharing. Be careful, your saved versions through the workbench are not saved online. So make sure that your workbench is downloaded to preserve a copy of your work for later use.
In Summary
Strategy creators now have the possibility to view most of the Deep Analysis indicators directly in the backtest page. You can also see the evolution of the strategies' performance in real time during a live session. With this new tool, it is also possible to save backtests and specific versions of your strategies to come back later during the creation phase.
Don't hesitate to join us on our Telegram and Discord groups as well as on our other social networks to share your opinion and feedback on the Kryll.io platform.

Happy Trading,
Website : https://kryll.io
Twitter : @Kryll.io
Telegram EN : https://t.me/kryll_io
Telegram FR: https://t.me/kryll_fr
ESTelegram : https://t.me/kryll_es
Discord : https://discord.gg/PDcHd8K
Facebook : https://www.facebook.com/kryll.io
Support : support@kryll.io


