
Part 3 - New strategy base and analysis
Welcome to the third part of this guide to using the Kryll Strategy Editor. In this part 3, we will learn how to use the "versioning" and analysis tools that Kryll offers for free.
Summary
Use this summary if you have missed the previous parts or want to move on to the next part
Kryll Editor: User Guide - Part 1
Kryll Editor: User Guide - Part 2
Kryll Editor: User Guide - Part 3 (you are here)
Kryll Editor: User Guide - Part 4 (coming soon)
Let's get the editor ready
Using the Supertrend indicator as an example to generate signals, we will use this indicator as a trend indicator and couple it to the Stochastic RSI oscillator.
We will therefore, as in the previous section, choose the pair "BNB/USDT", the time unit "1D" and add the necessary indicators: "Supertrend" and "StochRSI".
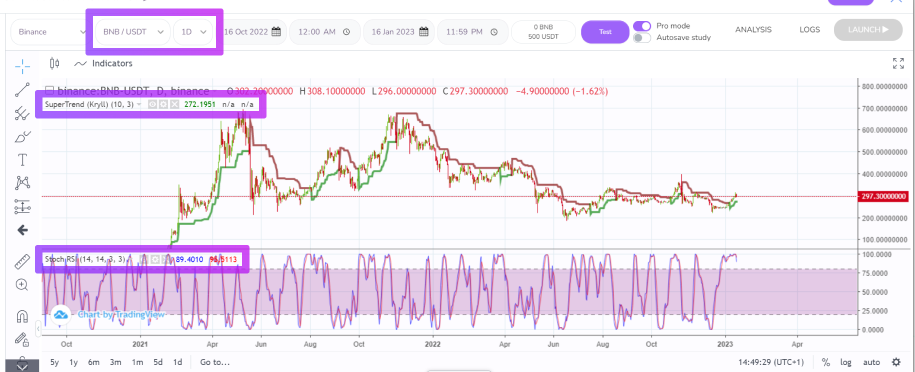
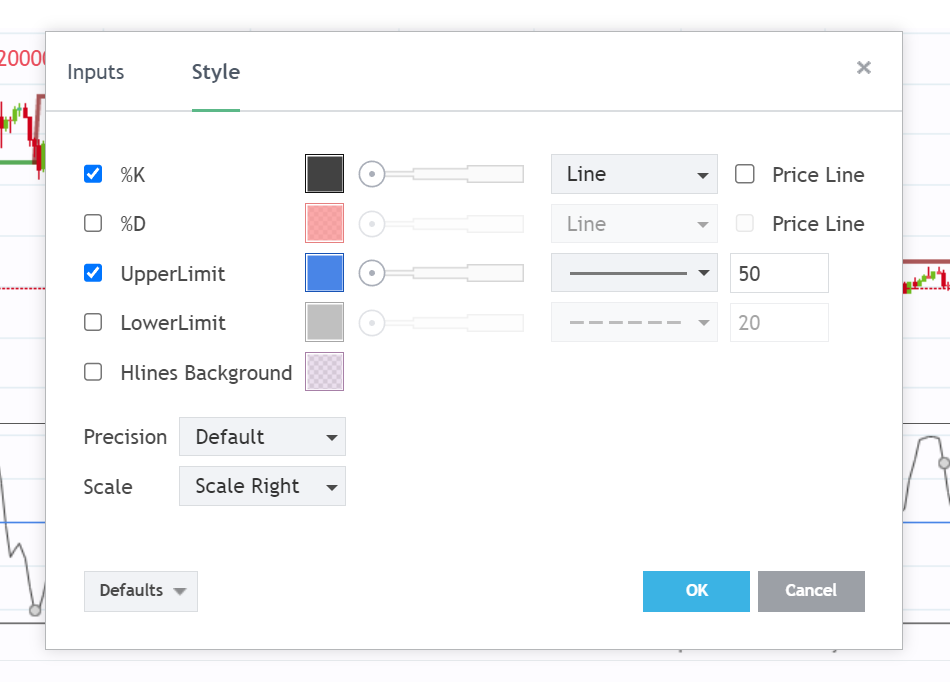
Our goal is to place a buy order when the StochRSI indicator is above 50 and when the Supertrend indicator indicates an upward trend. To do this, we need to change the parameters of the StochRSI indicator displayed on the chart:
- Disabling %D, LowerLimit and Hlines Background
- Setting UpperLimit to 50
Building the new strategy base
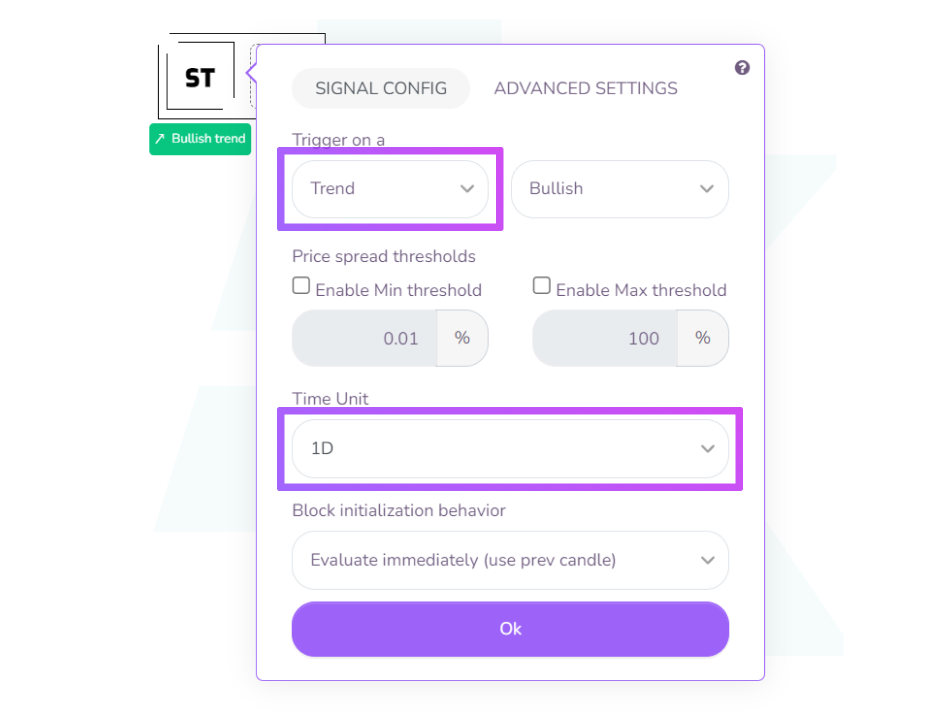
Once our environment is prepared, we can start building our strategy. We will place our first block (AND) in the editor and add a Supertrend block by dragging this block onto the AND block.
We will set its trigger type to "Trend - Bullish" and its time unit to "1D".
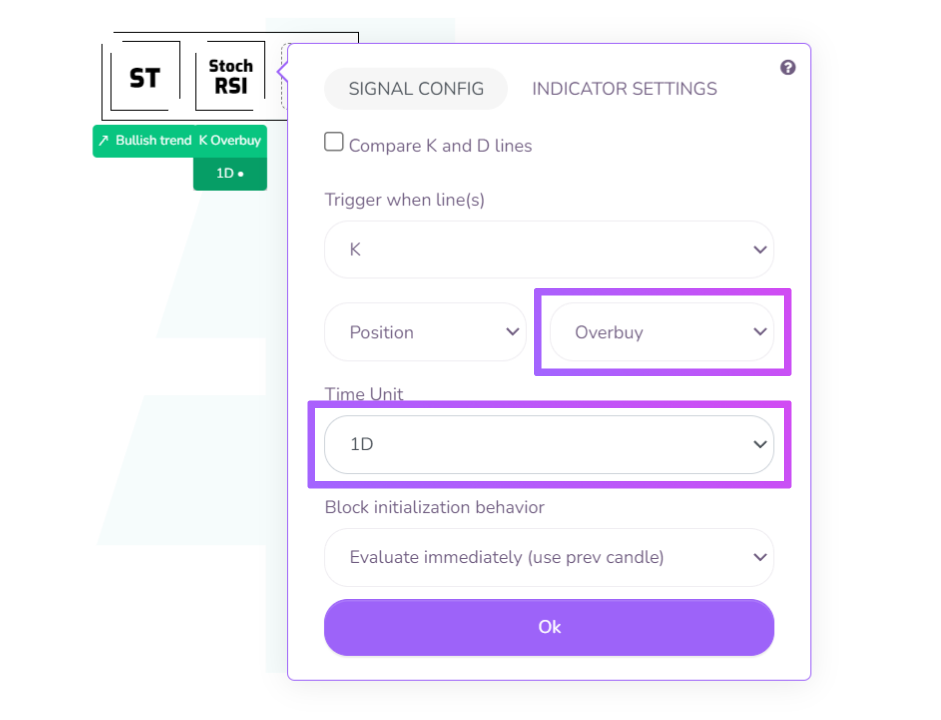
Next, we will add our StochRSI block in the second slot of the AND block and set its signal type to "Overbuy" and its time unit to "1D".
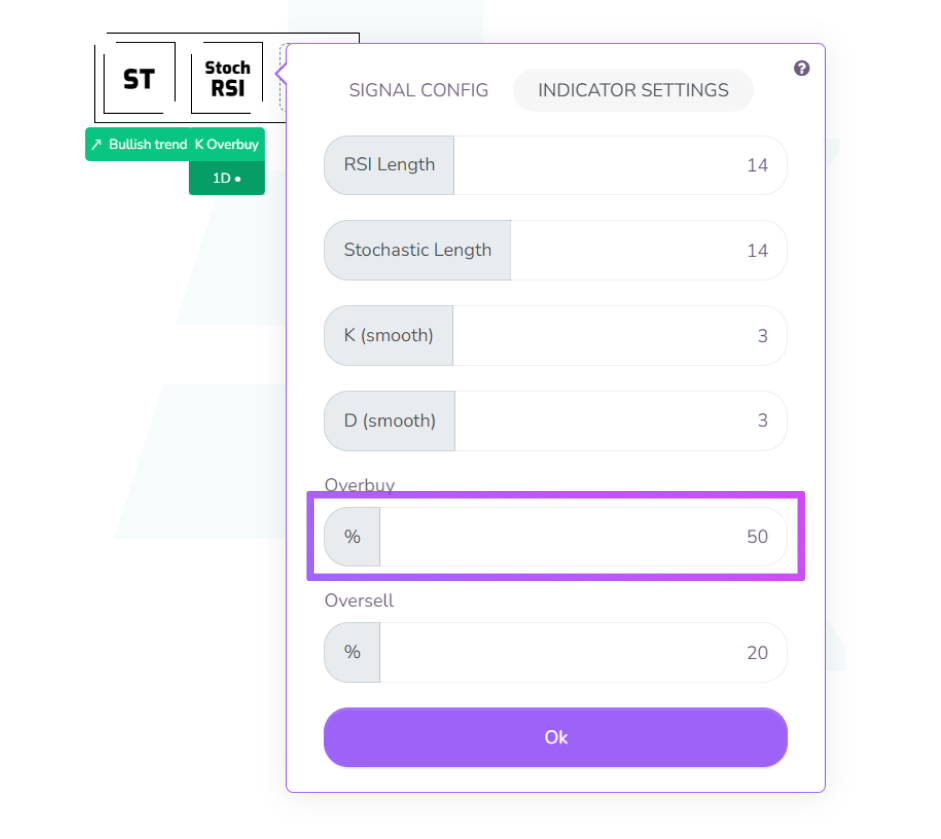
In the second tab "RSI Parameters", we will change the "Overbuy" parameter to 50, which corresponds to the "UpperLimit" parameter of the chart indicator.
Note: It is important to use the same settings for the editor and graph indicators to correctly visualise their behaviour.
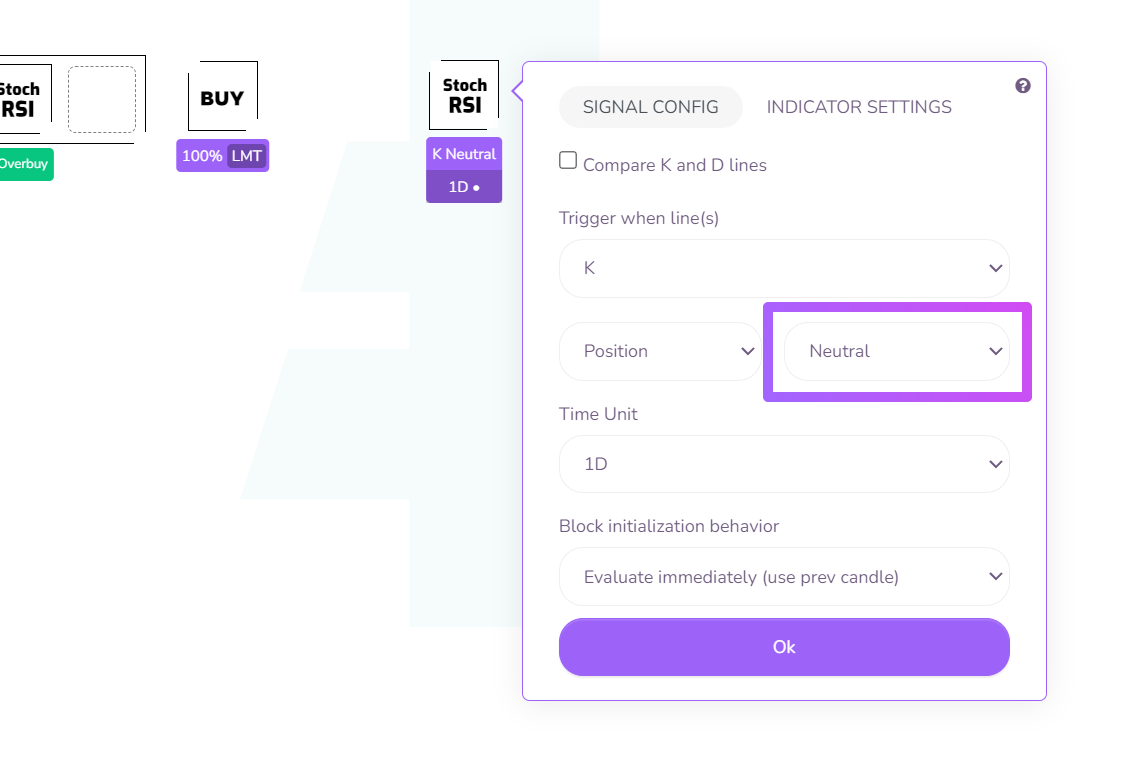
With our buy condition done, and our BUY block placed (documentation of the "Buy" block), let's now plan our exit conditions.
To do this, we will set up a second StochRSI block with the same parameters as the previous one to add to our strategy a condition to reduce the trade exposure by half. Only the position type will have to be set to "Neutral", this way our block will be validated when the StochRSI returns below the 50 level. This first event will allow us to make a first sale of 50%. (documentation of the "Sell" block)
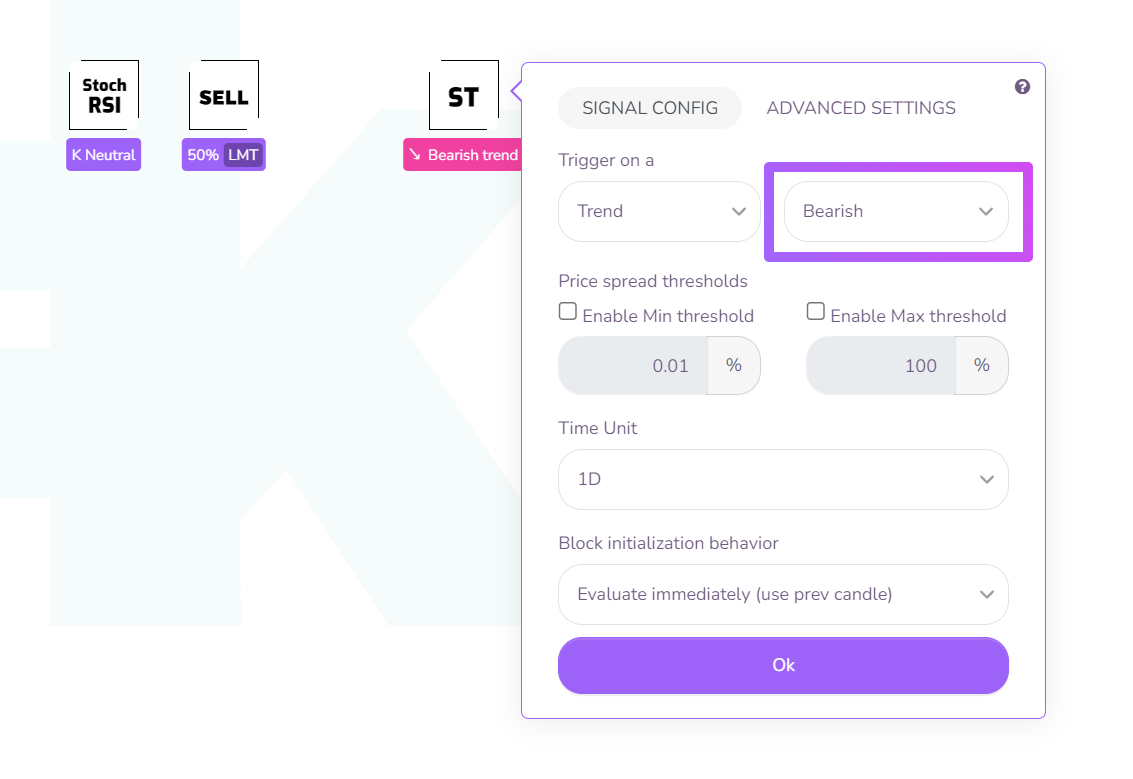
Once this first profit is taken, we will close the trade on a trend reversal. To do this, we will use a second Supertrend block with the same parameters as the previous one, only its trigger type will have to be set to "Trend - Bearish".
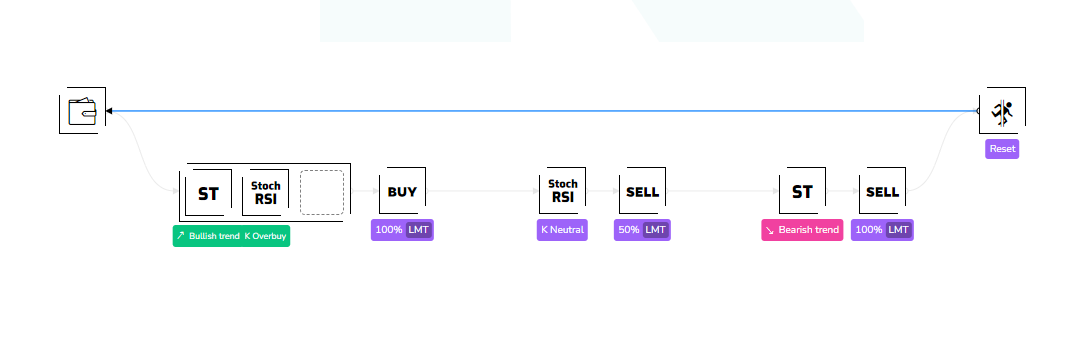
Finally, we can link all our blocks together and form a loop using the GoTo block as explained in part 2 of this tutorial:
Test environment and portfolio selection
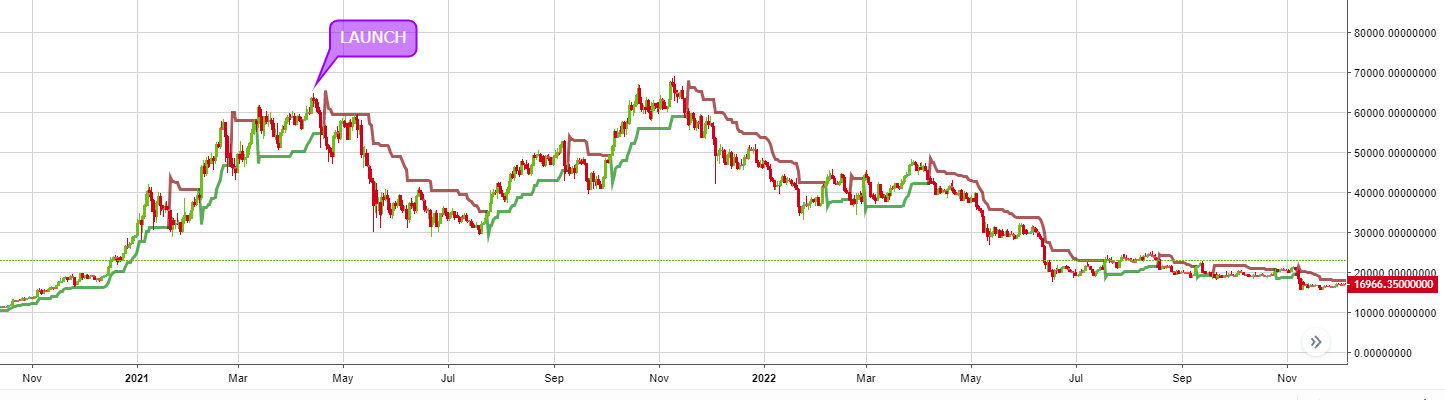
For all our tests, we will take the example of a user who arrived on April 14, 2021, the day Bitcoin marked the first top of the 2021 cycle, just before it suddenly lost 50% of its value in a few weeks.
To strengthen our tests, we will perform our backtest on 10 pairs, with the aim of simulating results on a properly diversified portfolio. Here is the list of the 10 cryptos selected for our tests:
Ethereum ($ETH): Ethereum is the first decentralised and open-source blockchain with smart contracts.
Binance ($BNB): $BNB is the utility token of Binance, the number one crypto exchange platform.
Solana ($SOL) and Fantom ($FTM): Although different, these Layer 2 blockchains present themselves as cheaper and faster alternatives to Ethereum.
Polkadot ($DOT): Polkadot is a Layer 0 blockchain linking multiple specialised blockchains into one unified network.
Polygon ($MATIC): Polygon is a blockchain linking several blockchains in the same way as Polkadot, except that it is presented as both a Layer 2 and a sidechain of Ethereum, making these two projects very different.
TerraLuna ($LUNA): TerraLuna was an algorithmic stablecoin ($UST) project that operated with a reserve of the Terra blockchain token ($LUNA). Following the de-peg of the $UST stablecoin, the $LUNA token lost -100% of its value despite the fact that this project was very popular. This makes it a perfect student to test our strategy.
PancakeSwap ($CAKE) : PancakeSwap is the number one decentralised exchange in the NBB Chain, the Binance blockchain.
Thetha Network ($THETA): Theta Network is a decentralised network project focused on peer-to-peer video streaming using the blockchain.
Enjin Network ($ENJ): Enjin Network is a content management system and social platform that revolves around video game protocols and platforms.
Backtest and workbench
We will now perform our backtests and save them to the "workbench".
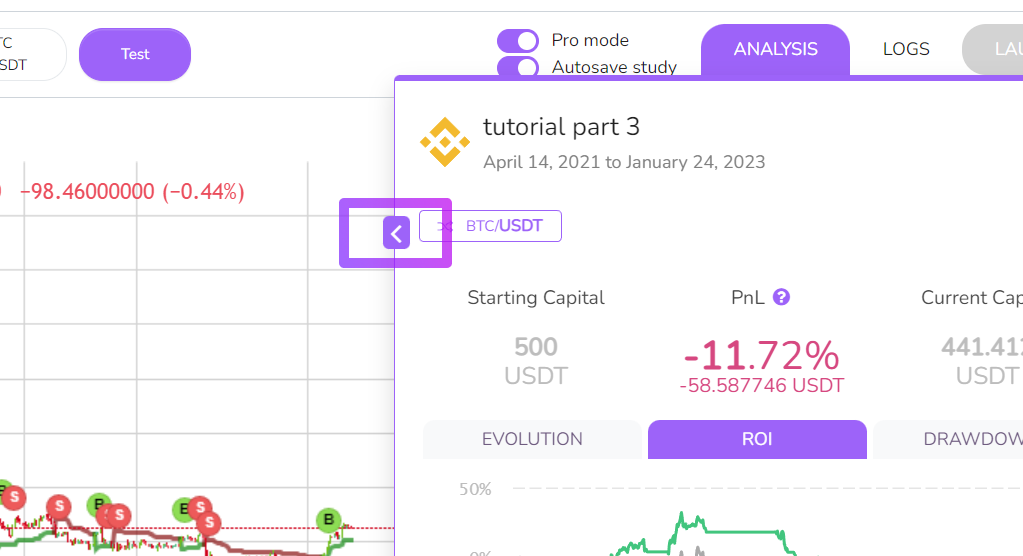
To start, we will select our first pair in the list (BTC/USDT), then we will choose April 14, 2021 as the start date as mentioned above. For the end date, we will choose the last full day available to us. In our case, 24 January 2023. (This way, the results will remain fixed and will not be impacted by the current day).
Once the backtest is complete, you can keep a snapshot of the strategy and the backtest you have just done in the workbench. This is particularly useful for comparing results, strategy versions and instantly reverting to a particular version or backtest.
To open it, click on the dedicated button in the analysis window:
Once the workbench is open, click on the "Add" button to save the backtest:
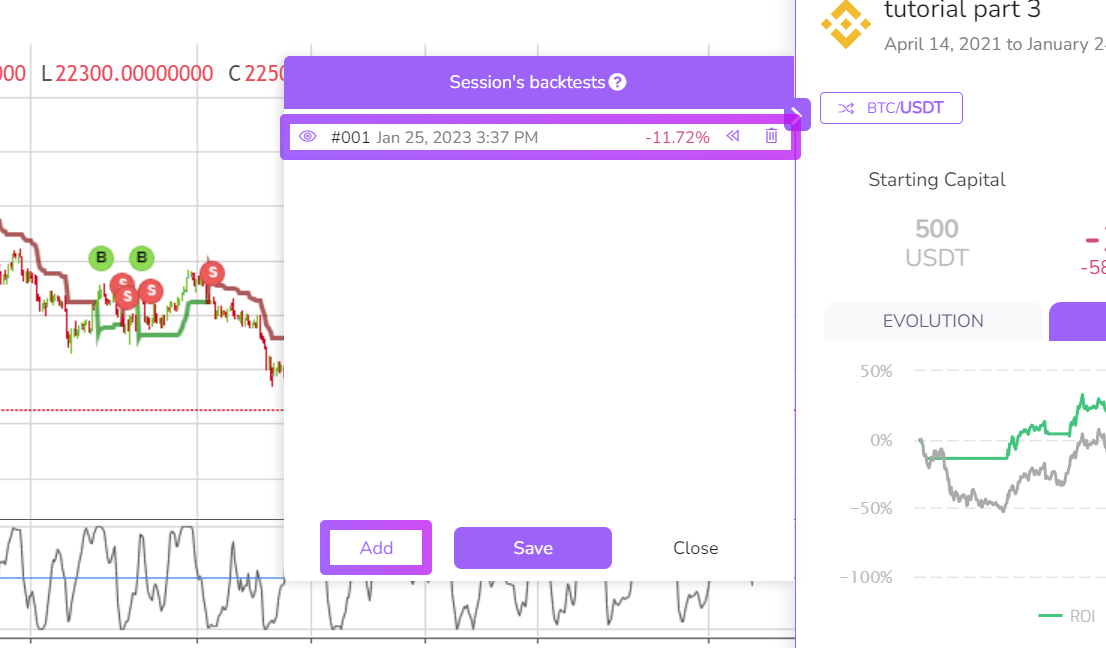
All we have to do is to do this for all the pairs we want to test. Once this is done, we will be able to access all our backtests in 1 click from this window.
Analysis tools
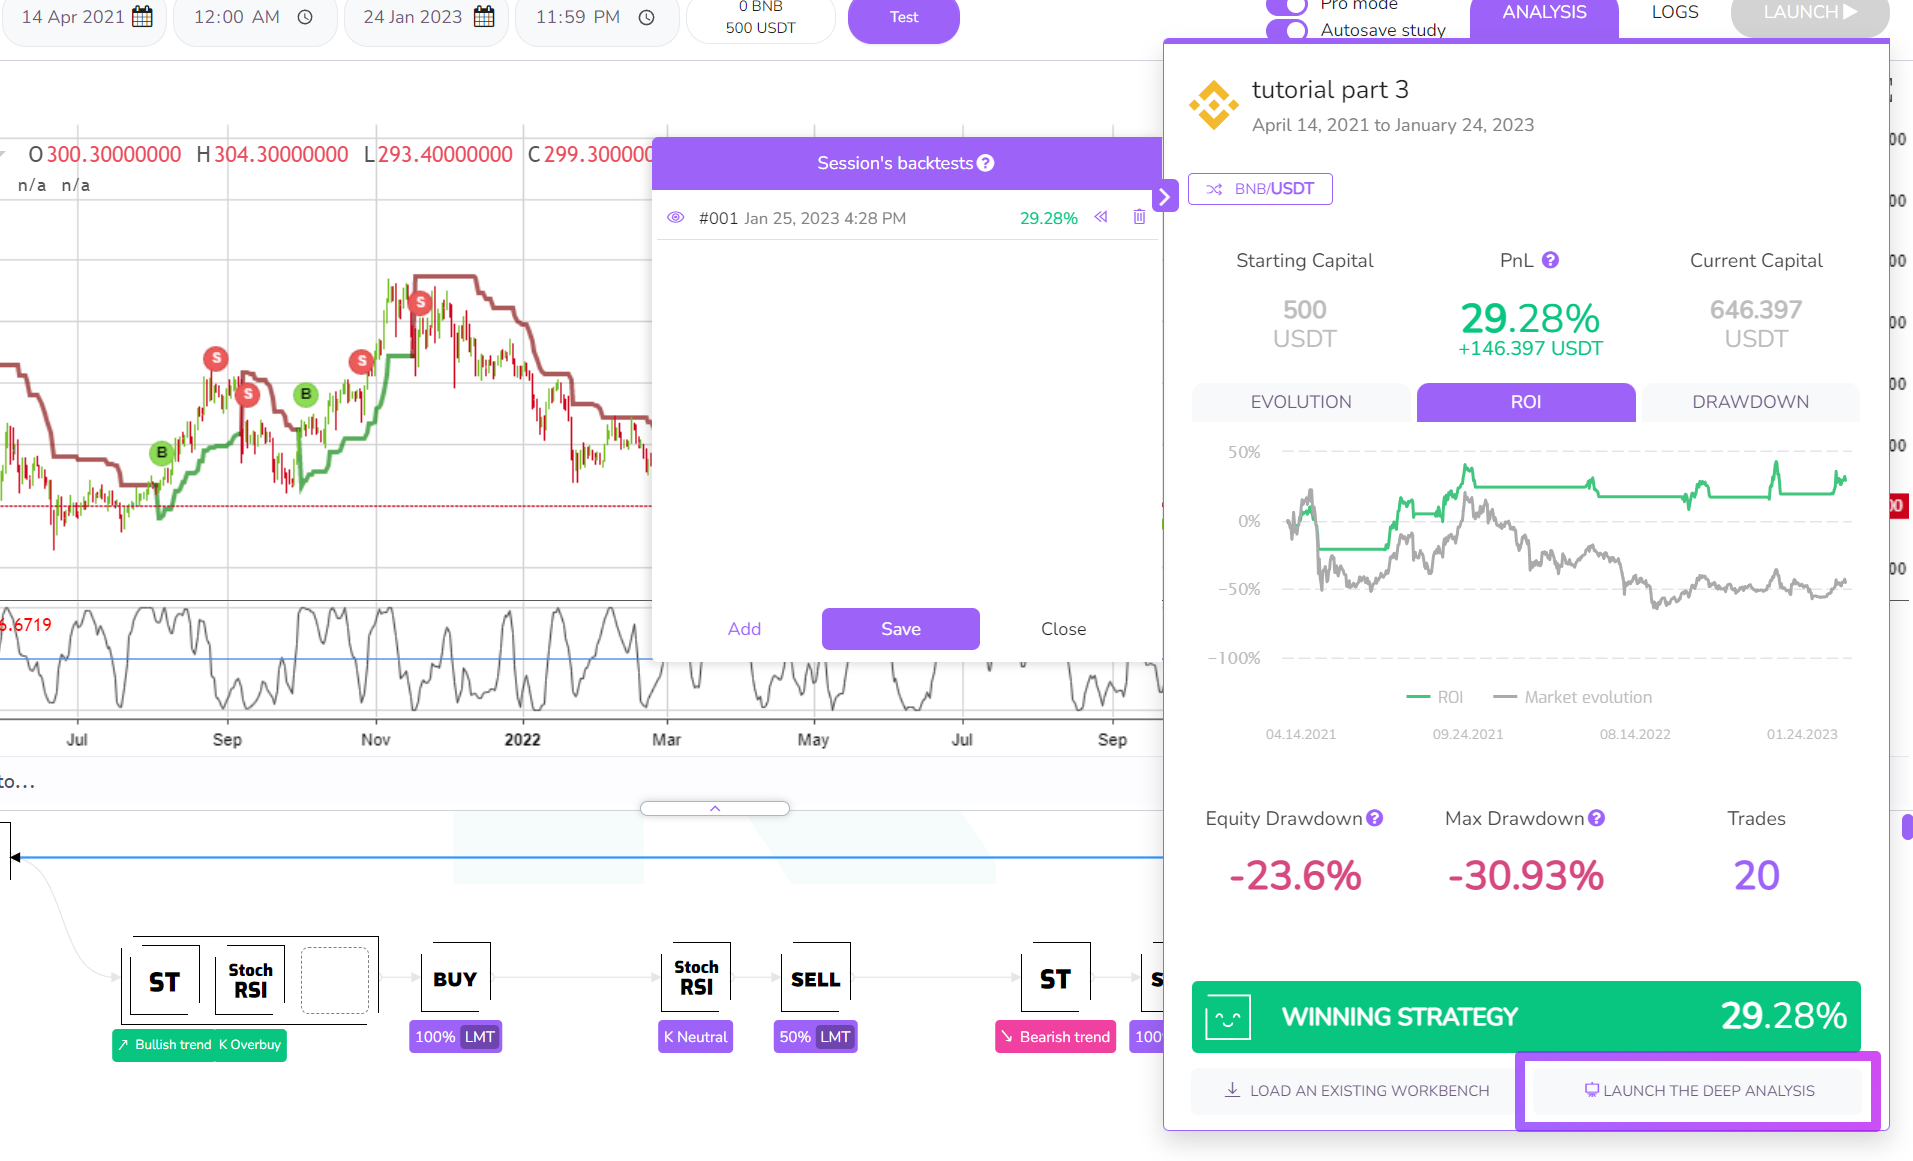
The analysis window is a great surface tool, you can find various information such as performance, number of trades, equity drawdown, max drawdown as well as various graphs illustrating the evolution of the capital, the ROI and the drawdown.
To go further, we provide an even more complete tool to analyse your strategy in depth: the "Deep Analysis". To access it, simply click on the dedicated button at the bottom right of the analysis window once your backtest is finished:
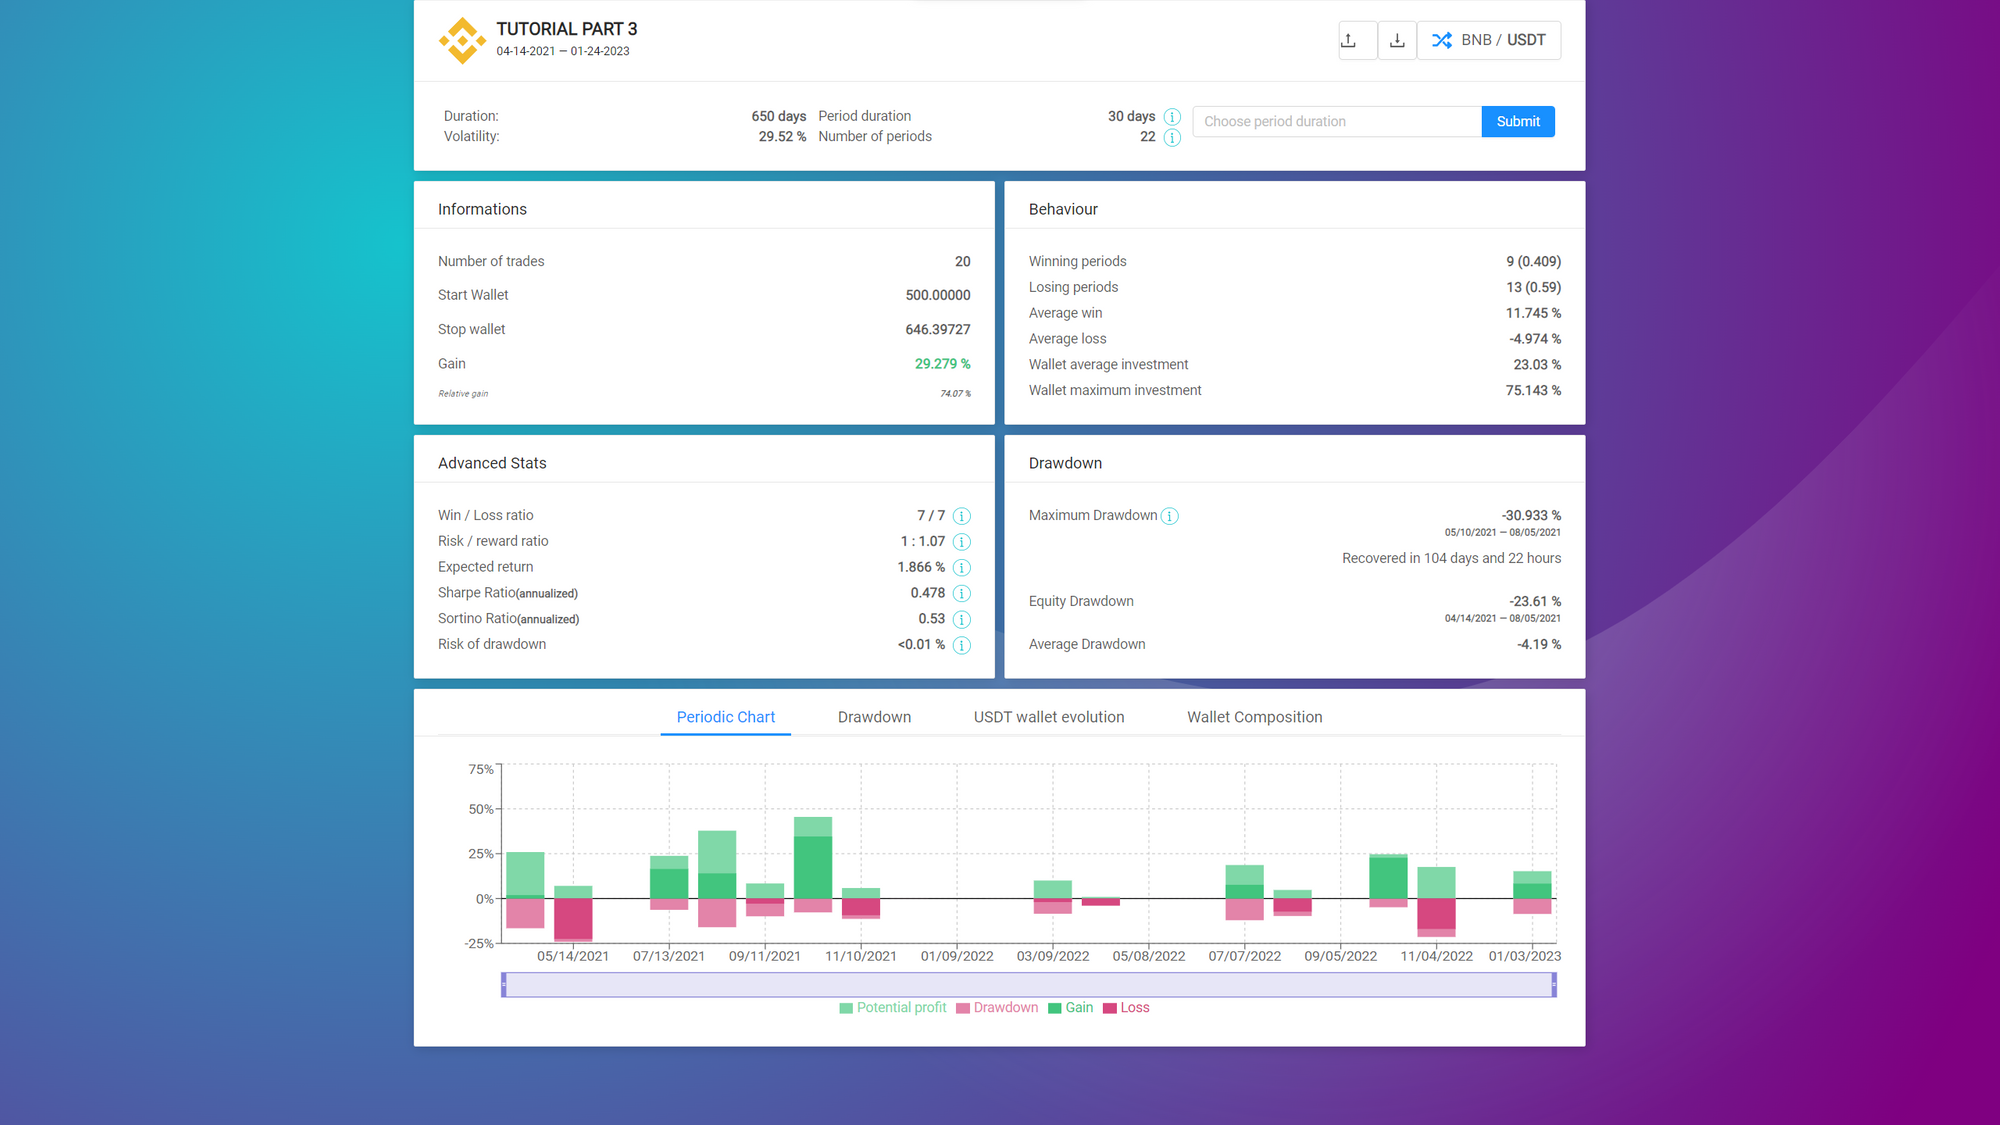
Results and conclusion
According to the results of the 10 backtests we have carried out, the overall performance of our strategy is 152% with an Equity Drawdown of -22% and a Max Drawdown of -46%.
The result is interesting as it would give us a theoretical annual return of 67% and beats by far the drawdown that the market has experienced during this period. However, the drawdown is still quite high and the Sharpe and Sortino ratios seem too low for our strategy to be viable in the long term.
Summary
Use this summary if you have missed the previous parts or want to move on to the next part
Kryll Editor: User Guide - Part 1
Kryll Editor: User Guide - Part 2
Kryll Editor: User Guide - Part 3 (you are here)
Kryll Editor: User Guide - Part 4 (coming soon)

Happy Trading,
Website: https://kryll.io
Twitter: @Kryll_io
Telegram EN: https://t.me/kryll_io
Telegram FR: https://t.me/kryll_fr
Telegram ES: https://t.me/kryll_es
Discord: https://discord.gg/PDcHd8K
Reddit: https://reddit.com/r/Kryll_io
Facebook: https://www.facebook.com/kryll.io
Support: support@kryll.io